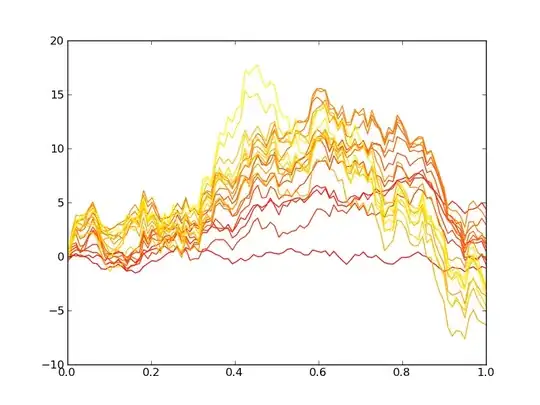
I have pretty similar code to plot:
plt.plot(df_tags[df_tags.detailed_tag == tag]['week'], df_tags[df_tags.detailed_tag == tag].tonality)
But I want leave only min and max values for x axis this way:
plt.plot(df_tags[df_tags.detailed_tag == tag]['week'], df_tags[df_tags.detailed_tag == tag].tonality)
plt.xticks([df_tags['week'].min(), df_tags['week'].max()])
print (df_tags['week'].min(), df_tags['week'].max())
With no luck, he puts second week as a last one, but why and how to fix it:


