With grid graphics,
library(grid)
ellipse <- function (x = 0, y = 0, a=1, b=1,
angle = pi/3, n=300)
{
cc <- exp(seq(0, n) * (0+2i) * pi/n)
R <- matrix(c(cos(angle), sin(angle),
-sin(angle), cos(angle)), ncol=2, byrow=T)
res <- cbind(x=a*Re(cc), y=b*Im(cc)) %*% R
data.frame(x=res[,1]+x,y=res[,2]+y)
}
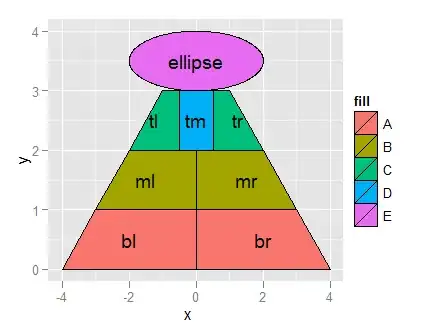
pyramidGrob <- function(labels = c("ellipse", paste("cell",1:7)),
slope=5,
width=1, height=1,
fills=c(rgb(0, 113, 193, max=256),
rgb(163, 163, 223, max=256),
rgb(209, 210, 240, max=256),
rgb(217, 217, 217, max=256)), ...,
draw=FALSE){
a <- 0.4
b <- 0.14
ye <- 3/4 + b*sin(acos((3/4 / slope-0.5)/a))
e <- ellipse(0.5, ye, a=a, b=b,angle=0)
g1 <- polygonGrob(e$x, e$y, gp=gpar(fill=fills[1]))
x1 <- c(0, 0.5, 0.5, 1/4 / slope, 0)
y1 <- c(0, 0, 1/4, 1/4, 0)
x2 <- c(1/4 / slope, 0.5, 0.5, 1/2 / slope, 1/4/slope)
y2 <- y1 + 1/4
x3 <- c(1/2 / slope, 0.5, 0.5, 3/4 / slope, 1/2/slope)
y3 <- y2 + 1/4
x4 <- c(0.5 - 3/4/slope, 0.5 + 3/4/slope,
0.5 + 3/4 / slope, 0.5 - 3/4/slope,
0.5 - 3/4/slope)
y4 <- y3
d <- data.frame(x = c(x1,1-x1,x2,1-x2,x3,1-x3,x4),
y = c(y1,y1,y2,y2,y3,y3,y4),
id = rep(seq(1,7), each=5))
g2 <- with(d, polygonGrob(x, y, id,
gp=gpar(fill=fills[c(rep(2:4,each=2),4)])))
x5 <- c(0.5, 0.25, 0.25, 0.25, 0.75, 0.75, 0.75, 0.5)
y5 <- c(3/4+1/8, 1/8, 1/2 - 1/8, 1/2 + 1/8,
1/8, 1/2 - 1/8, 1/2 + 1/8, 1/2 + 1/8)
g3 <- textGrob(labels, x5,y5, vjust=1)
g <- gTree(children=gList(g1,g2,g3), ...,
vp=viewport(width=width,height=height))
if(draw) grid.draw(g)
invisible(g)
}
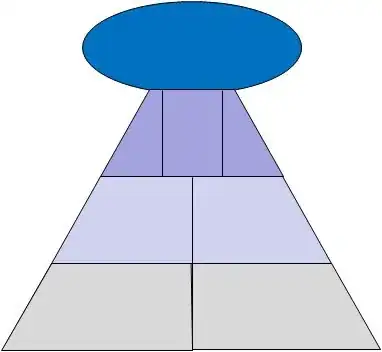
grid.newpage()
## library(gridExtra)
source("http://gridextra.googlecode.com/svn/trunk/R/arrange.r")
grid.arrange(pyramidGrob(height=0.4),
pyramidGrob(),
pyramidGrob(width=0.5),ncol=2)

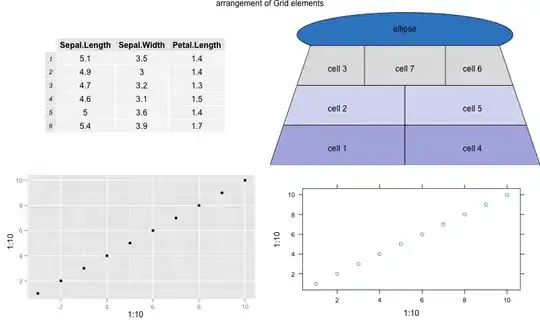
Further, Grid viewports can be used to place different objects on the same page. For instance,
library(gridExtra)


grid.arrange(tableGrob(head(iris)[,1:3]),
           pyramidGrob(), qplot(1:10,1:10),
           lattice::xyplot(1:10~1:10), ncol=2,
           main = "arrangement of Grid elements")