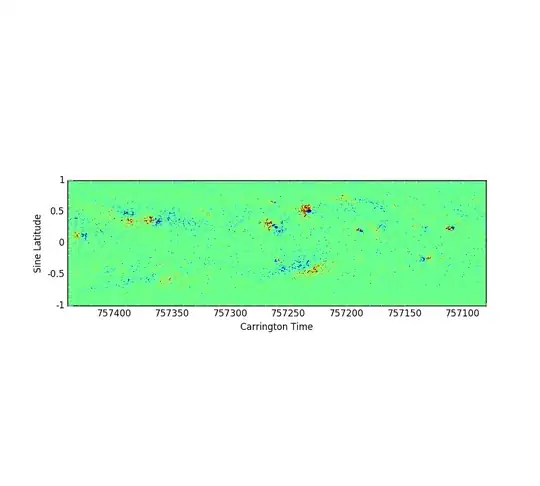
I am trying to open a full-color image from a '.fits' file. But, when comparing it to the corresponding '.gif' image, there appears to be an error regarding its color and size.
How can I view the real-color image in its proper dimensions?
As an example, one can select the '.fits' file and corresponding '.gif' file located at the top of this webpage. My example code, which uses the APLPY module, is below.
def from_fits_to_image(color_scheme, rloc, rname='synop_Ml_0.2104', rext='.fits', cmap=None):
    """
    color_scheme : 'rgb', 'grayscale', or 'false color'; color scheme of image to be shown
    rloc         : type <str>; location of file to be read
    rname        : type <str>; name of file to be read
    rext         : type <str>; extension of file to be read
    cmap         : None or type <str>; colormap
    """
    rpath = rloc + rname + rext
    if color_scheme == 'rgb':
        pic = aplpy.FITSFigure(rpath)
        # pic.show_rgb(alt_filename) # what filename is supposed to go here?
    else:
        pic = aplpy.FITSFigure(rpath)
        if color_scheme == 'grayscale':
            pic.show_grayscale()
        elif color_scheme == 'false color':
            if cmap is None:
                pic.show_colorscale()
            else:
                pic.show_colorscale(cmap=cmap)
    # plt.savefig(...)
    plt.show()
So long as one provides the proper rloc (the location of the downloaded '.fits' file) and color_scheme, the above code will run.
Calling the function below will show an empty plot of the proper dimensions. To make it non-empty, I must supply another existing filename, though I am unclear on what exactly that should be.
from_fits_to_image(color_scheme='rgb', rloc=rloc)
Each of the function calls below reveal a plot that has been resized to small. While color_scheme='grayscale' seems to colorize the plot properly, the other methods do not properly colorize the image.
from_fits_to_image('grayscale', rloc=rloc)
from_fits_to_image('false color', rloc=rloc)
from_fits_to_image('false color', rloc=rloc, cmap='plasma')
For comparison, the '.gif' image is below. Ideally, the output will look exactly like the image below.
EDIT:
I have tried using astropy, PIL, and pyfits unsuccessfully. Any help would be appreciated.
EDIT 2:
Below is the result using fits from astropy.io.
from astropy.io import fits

def reada(rloc, rname='synop_Ml_0.1998', rext='.fits'):
    """ """
    rpath = rloc + rname + rext
    # hdu_list = fits.open(rpath)
    # hdu_list.info()
    pic = fits.getdata(rpath)
    plt.imshow(pic)
    plt.show()

reada(rloc=rloc)
I've played with the vmin and vmax kwargs, but to no success. Also, using pyfits to open the file results in the following error, even when using pyfits.open(rpath, uint=True, do_not_scale_image_data=True):
TypeError: Image data can not convert to float


