0

Here is my data: https://pastebin.com/raw/6QBDEZaF

Here is my code (if you read the above csv file into "data", with a header):

library(ggplot2)
ggplot(data = mydata, aes(d1,d2)) +
  geom_raster(aes(fill = ratio), interpolate = FALSE) + 
  scale_fill_gradientn(
    colours = c("black","#dda158","#e2cf83","#8ed1b2","#2faf5c","#08770c"),
    values = c(0,0.4,0.45,0.5,0.6,0.8,1)) +
  theme_minimal()

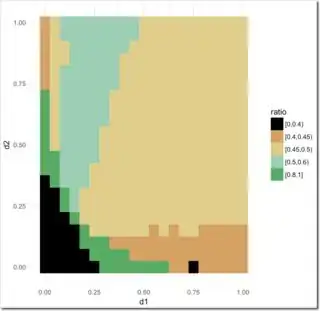
This produces a raster plot where the scale blends the colours in both the plot and the legend together. I'd like to use ONLY those 6 colours with no blending in both the plot and the legend, so there are 6 colours and each point is assigned one of those.

I tried binning my data beforehand and then plotting this, but that's very messy to do and doesn't change the legend. I tried using other functions than geom_raster, but none give me the result I want. I know there must be an easy solution, but I can't find it. Thanks a lot.
George Moore
  • 115
  • 4
  • please prefer to give a part of your data using dput() and copy the output, or give a dummy example reproducing the problem you are facing, instead of giving a link to your data. See https://stackoverflow.com/questions/5963269/how-to-make-a-great-r-reproducible-example – denis Apr 10 '18 at 15:19
  • ok sure, noted for future. – George Moore Apr 10 '18 at 15:31

1 Answers1

0

Use cut() to bin your data:

df$ratio <- cut(df$ratio, breaks = c(0,0.4,0.45,0.5,0.6,0.8,1),
                include.lowest = T, right = F)

ggplot(data = df, aes(d1,d2)) +
  geom_raster(aes(fill = ratio), interpolate = FALSE) + 
  scale_fill_manual(values = c("black","#dda158","#e2cf83",
                               "#8ed1b2","#2faf5c","#08770c")) +
  theme_minimal()

enter image description here

Martin Schmelzer
  • 23,283
  • 6
  • 73
  • 98
  • This works perfectly and I'm not quite sure why I hadn't done it, I think for some reason I was thinking the legend didn't come out the way I wanted. Anyhow, thanks a lot! – George Moore Apr 10 '18 at 15:34