1

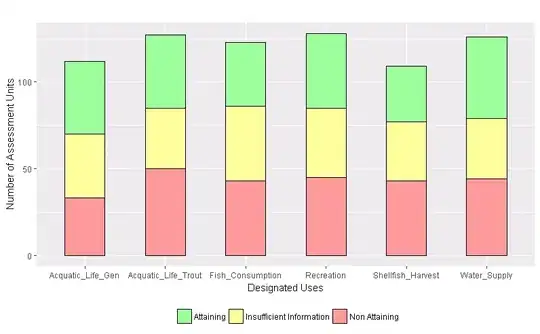
I'm a newbie to R and I'm stuck on creating the following bar plot in ggplot2:

Bar Plot Screenshot

Here is the code I have so far:

#Read in data
parameter_results<- readRDS("param_results_2014.RDS")

#list of parameter names
parameters <- sort(readRDS("parameters.RDS"))

bar_plot <- function(parameter) {
  parameter_df <- parameter_results %>%
    select(results = parameter) %>%  #keep only column for the parameter you want to plot
    filter(results != "Not Applicable") %>% 
    count(results) %>%    
    mutate(prop = prop.table(n), perc = paste0(round(prop * 100),"%"))
  color_code <- c("Attaining" = "#99FF99","Non Attaining" =  "#FF9999", "Insufficient Information" =  "#FFFF99")

  values <- vector(mode = "numeric", length = nrow(parameter_df))
  labs <- vector(mode = "character", length = nrow(parameter_df))
  colors <- vector(mode = "character", length = nrow(parameter_df))
  for (i in seq_along(1:nrow(parameter_df))) {
    values[[i]] <- parameter_df$prop[[i]] * 100
    labs[[i]] <- parameter_df$perc[i]
    colors[[i]] <- color_code[[parameter_df$results[[i]]]]
  }

  stacked_bar<-ggplot(parameter_df,aes(x=parameter,y=n,fill = fct_inorder(results)))+
    geom_bar(stat = "identity", width = 0.5,color="black") +
    blank_theme + theme(legend.title=element_blank()) +
    ggtitle("Figure ES-2: Statewide Designated Use Assessment Results, 2014") + 
    xlab("Designated Uses")+
    ylab("Number of Assessment Units")+
    theme(plot.title = element_text(hjust = 0.5,vjust=10))   +
    scale_fill_manual(values = c("Attaining" = "#99FF99","Non Attaining" = "#FF9999","Insufficient Information" = "#FFFF99"))      
}

bar_plot()
bar_ALG <-bar_plot('ALG')

My dataset looks like the following:

 A tibble: 958 x 89
   WMA   Waterbody  Name      `Biological (Caus~ `Biological Trout~ DO     `DO Trout` Temperature  `Temperature Tr~ pH    
   <chr> <chr>      <chr>     <chr>              <chr>              <chr>  <chr>      <chr>        <chr>            <chr> 
 1 15    020403020~ Absecon ~ Attaining          Not Applicable     Attai~ Not Appli~ Attaining    Not Applicable   Attai~
 2 15    020403020~ Absecon ~ Insufficient Info~ Not Applicable     Non A~ Not Appli~ Attaining    Not Applicable   Insuf~
 3 15    020403020~ Absecon ~ Attaining          Not Applicable     Insuf~ Not Appli~ Insufficien~ Not Applicable   Non A~
 4 15    020403020~ Absecon ~ Attaining          Not Applicable     Attai~ Not Appli~ Attaining    Not Applicable   Attai~
 5 14    020403011~ Albertso~ Non Attaining      Not Applicable     Attai~ Not Appli~ Attaining    Not Applicable   Non A~
 6 11    020401052~ Alexauke~ Attaining          Attaining          Insuf~ Attaining  Insufficien~ Non Attaining    Non A~
 7 11    020401052~ Alexauke~ Attaining          Attaining          Insuf~ Attaining  Insufficien~ Non Attaining    Non A~
 8 17    020402060~ Alloway ~ Non Attaining      Not Applicable     Attai~ Not Appli~ Attaining    Not Applicable   Attai~
 9 17    020402060~ Alloway ~ Insufficient Info~ Not Applicable     Attai~ Not Appli~ Attaining    Not Applicable   Insuf~
10 17    020402060~ Alloway ~ Insufficient Info~ Not Applicable     Insuf~ Not Appli~ Insufficien~ Not Applicable   Insuf~

parameter_df:

parameter_df
## # A tibble: 2 x 4
##                    results     n      prop  perc
##                      <chr> <int>     <dbl> <chr>
## 1                Attaining   454 0.5443645   54%
## 2 Insufficient Information   380 0.4556355   46%

Each parameter has its own column… and each row of the data table contains the assessment values for a given location for each parameter. My question is what do I need to do to the dataset or the function in order to have each parameter plotted like the graph above?

This is the plot I'm getting: enter image description here

NBE
  • 641
  • 2
  • 11
  • 33
  • 1
    did you see https://stackoverflow.com/questions/21236229/stacked-bar-chart or http://rstudio-pubs-static.s3.amazonaws.com/3256_bb10db1440724dac8fa40da5e658ada5.html ? – shosaco Apr 12 '18 at 16:43
  • @Parfait Yeah I want my plot to look just like the one I attached.. however I'm only able to plot one parameter with the function that I have and I don't understand how to make it so I can have multiple parameters graphed like the graph I want – NBE Apr 12 '18 at 16:44
  • @shosaco I tried that but it doesn't seem to work ... – NBE Apr 12 '18 at 16:47
  • @Parfait I attached the plot that I'm getting. – NBE Apr 12 '18 at 17:11
  • @Parfait Sorry forgot the last line of code.. but its the code that I have above. – NBE Apr 12 '18 at 17:17
  • Where is *ALG*, *n*, *results* columns used in graph in your example dataset tibble? Please post actual *parameters_df* for reproducible example. – Parfait Apr 12 '18 at 18:06
  • @Parfait I edited it – NBE Apr 12 '18 at 18:18
  • @KWANGER please copy and paste the [`dput()`](http://stat.ethz.ch/R-manual/R-devel/library/base/html/dput.html) output of your objects - presumably `parameters`, `parameter_results` and `parameter_df` - into the question. This will help others quickly replicate your issue and present solutions. – Cristian E. Nuno Apr 12 '18 at 18:37

1 Answers1

1

Avoid running graph iteratively across the parameters but run on entire dataframe, parameter_results. However, first consider transforming the data with tidyr::gather and dplyr::group_by to calculate category tabs:

library(dplyr)
library(tidyr)
library(ggplot2)

# RESHAPE WIDE TO LONG
rdf <- parameter_results %>%
  gather(value = colnames(parameter_results)) %>%
  setNames(c("parameter", "results"))

# GROUP BY PARAMETER CALCULATIONS
graph_df <- rdf %>%
  group_by(parameter) %>%
  filter(results != "Not Applicable") %>% 
  count(results) %>%    
  mutate(prop = prop.table(n), 
         perc = paste0(round(prop * 100),"%"))

color_code <- c("Attaining"="#99FF99", "Non Attaining"="#FF9999", 
                "Insufficient Information"="#FFFF99")

# GRAPH ALL PARAMETERS TOGETHER AT ONCE
ggplot(graph_df, aes(x=parameter, y=n, fill = results)) +
  geom_bar(stat = "identity", width = 0.5,color="black") +
  theme(legend.title=element_blank()) +
  ggtitle("Figure ES-2: Statewide Designated Use Assessment Results, 2014") + 
  xlab("Designated Uses")+
  ylab("Number of Assessment Units") +
  theme(legend.position="bottom", plot.title = element_text(hjust=0.5, vjust=10)) +
  scale_fill_manual(values = color_code) 

Input (using random data of 200, assuming parameters_results to be a similar structure)

categ <- c("Attaining", "Insufficient Information", "Non Attaining", "Not Applicable")

set.seed(555)
parameter_results <- data.frame(
  Acquatic_Life_Gen = sample(categ, 200, replace=TRUE),
  Acquatic_Life_Trout = sample(categ, 200, replace=TRUE),
  Recreation = sample(categ, 200, replace=TRUE),
  Water_Supply = sample(categ, 200, replace=TRUE),
  Shellfish_Harvest = sample(categ, 200, replace=TRUE),
  Fish_Consumption = sample(categ, 200, replace=TRUE)
)

Output

Plot Output

Parfait
  • 104,375
  • 17
  • 94
  • 125
  • Thanks that worked! However, I am no getting this new error : Error in count(., results) : object 'results' not found ... as well as.. Error in ggplot(graph_df, aes(x = parameter, y = n, fill = results)) : object 'graph_df' not found @Parfait – NBE Apr 13 '18 at 18:30
  • I provided a more detailed view of parameter_results. See edit. I am very confused on your last comment. – NBE Apr 13 '18 at 18:49
  • Please check if `graph_df` properly generated? Does it have columns, *parameter*, *results*, *n*, *prop*, *perc*? Error says it does not exist. If it does not, check console for error at its line. Please also delete previous unneeded comments in this thread so this does not drag too long. – Parfait Apr 13 '18 at 19:54