18

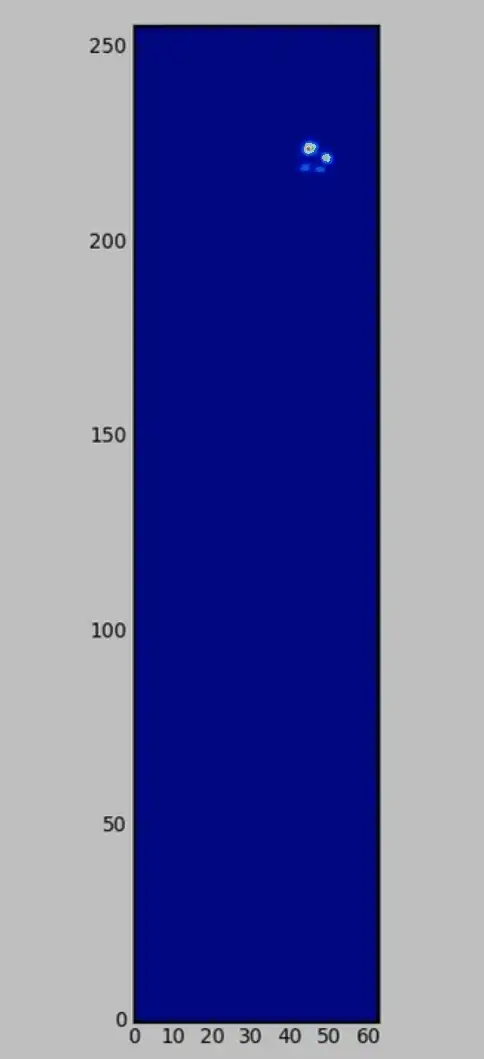
I'm trying to create a Matplotlib animation of my paw data, where you can see the pressure distribution on the entire pressure plate over time (256x64 sensors for 250 frames).

I found a working example on Matplotlib's own site and managed to get it working on my own data. However the 'animation' is awfully slow and I have no idea how to speed it up.

Here's an example of a gif Joe Kington made in another answer, which is about the speed with which it gets displayed. Considering the measurements are done at 125 Hz, this makes the measurements look awfully slow. If it ran at 30-60 fps, it could be run in 4 or 8 seconds rather than the current 20+.

enter image description here enter image description here

I don't mind using whatever tool I need to get the job done, as long as there's some good documentation to figure out how to do it.

So my question is: how can I speed up these animations?

I've implemented Ignacio's suggestion to put in t.Start(1), however it only runs 'decently' when the Figure is this large:

enter image description here

class PlotFigure(Frame):
    """ This class draws a window and updates it with data from DataCollect
    """
    def __init__(self):
        Frame.__init__(self, None, -1, "Test embedded wxFigure")
        #Varying the size of Figure has a big influence on the speed            
        self.fig = Figure((3,3), 75) 
        self.canvas = FigureCanvasWxAgg(self, -1, self.fig)
        EVT_TIMER(self, TIMER_ID, self.onTimer)

    def init_plot_data(self):
        self.datagen = DataCollect(array3d)
        self.axes = self.fig.add_subplot(111)
        self.axes.imshow(self.datagen.next().T)

    def onTimer(self, evt):
        self.data = self.datagen.next()
        self.axes.imshow(self.datagen.next().T)
        self.canvas.draw()

When I resize the window during the animation, it immediately slows down to a crawl. Which makes me suspect the delay isn't the only cause of the slow down. So any other suggestions? In case you're curious, here's a link to one of the ASCII files.

Community
  • 1
  • 1
Ivo Flipse
  • 10,222
  • 18
  • 50
  • 63
  • 2
    [Nope dog paws](http://superivo.wordpress.com) – Ivo Flipse Feb 15 '11 at 11:55
  • what about creating png-files and stitching them in animated gif? – Luka Rahne Feb 15 '11 at 12:22
  • This doesn't seem like a great long-term solution @ralu, because I would have to store all the gifs along side the data as well. Generating the gifs every time the clinician wants to look at a measurement seems cumbersome as well... I would prefer to learn how to do it properly – Ivo Flipse Feb 15 '11 at 12:26

3 Answers3

10

I found Joe Kington's answer that mentioned using Glumpy instead. At first I couldn't get it to work on my own data, but with some help on chat we managed to figure out how to adapt one of the Matplotlib examples that come with Glumpy to work on my data.

import numpy, glumpy
from glumpy.pylab import *

window = glumpy.Window(256,64)
Z = data.astype(numpy.float32)

t0, frames, t = 0,0,0
fig = plt.figure(figsize=(7,7))
ax = plt.subplot(111)
ax = imshow(Z[:,:,0], origin='lower', interpolation='bilinear')
show()
window = glumpy.active_window()

@window.event
def on_idle(dt):    
    global Z, t0, frames, t
    
    t += dt
    frames = frames + 1
    if frames > 248:
        fps = float(frames)/(t-t0)
        print 'FPS: %.2f (%d frames in %.2f seconds)' % (fps, frames, t-t0)
        frames,t0 = 0, t
    
    for image, axis, alpha in items:
        image.data[...] = Z[:,:,frames]
        image.update()
    window.draw()

window.mainloop()

The end result can be seen here, it doesn't matter how large I make the window, it will run at a very steady 58+ fps. So I must say, I'm very pleased with the end result!

enter image description here

Community
  • 1
  • 1
Ivo Flipse
  • 10,222
  • 18
  • 50
  • 63
  • I get `Traceback (most recent call last): File "main.py", line 4, in window = glumpy.Window(256,64) File "/Library/Frameworks/EPD64.framework/Versions/7.3/lib/python2.7/site-packages/glumpy/window/backend_glut.py", line 95, in __init__ window.Window.__init__( self, size, position, title ) File "/Library/Frameworks/EPD64.framework/Versions/7.3/lib/python2.7/site-packages/glumpy/window/window.py", line 156, in __init__ self._width, self._height = size TypeError: 'int' object is not iterable` – working4coins Oct 05 '13 at 07:07
  • 1
    Perhaps they changed the function. The init reads: `def __init__( self, size=(640,480), position=(0,0), title=None ):` So try changing `glumpy.Window(256,64)` to `glumpy.Window(size=(256,64))` – Ivo Flipse Oct 05 '13 at 18:46
4

The value passed to wx.Timer.Start() is the trigger rate in milliseconds. Pass a smaller value.

Ignacio Vazquez-Abrams
  • 776,304
  • 153
  • 1,341
  • 1,358
  • It works in the Matplotlib example @Ignacio, so I'll have to figure out how to replicate it with my own data – Ivo Flipse Feb 15 '11 at 12:23
  • I managed to tweak my code so I got to set the interval to 1. But it's still not really performant... Any other suggestions perhaps? – Ivo Flipse Feb 16 '11 at 11:17
  • At this point other things are acting as bottlenecks, such as the CPU, video card, or memory (or, of course, the code itself). Try testing it with a smaller image. – Ignacio Vazquez-Abrams Feb 16 '11 at 11:28
  • Well it runs fast with the example from Matplotlib, but slows down with my array. It also grows slower when the drawing surface becomes larger. Given the specs of my computer, I'd suspect my problem is in my code :\ – Ivo Flipse Feb 16 '11 at 11:37
1

Use a Profiler to find the root cause, frame skipping might be useful too as a last resort.

Or switch to an alternative solution like Double Buffering using Device Contexts or PyOpenGL...

Tamara Wijsman
  • 12,198
  • 8
  • 53
  • 82