See these 2 data.frames:
df1 <- data.frame(var=letters[1:3],val=1:3)
df2 <- df1[-1,]
Note that var is a factor in both data.frames and that level c is in df2$var
df2$var
# [1] b c
# Levels: a b c
If I use facets I get my bars filled with the expected color:
library
library(dplyr)
bind_rows(df1,df2,.id = "id") %>%
  ggplot(aes(1,val,fill=var)) +
    geom_bar(stat="identity",position="fill") +
    facet_wrap(~id)
(Sorry I can't upload charts at present time)
But if I want to do 2 separate plots, I can't keep the same color theme.
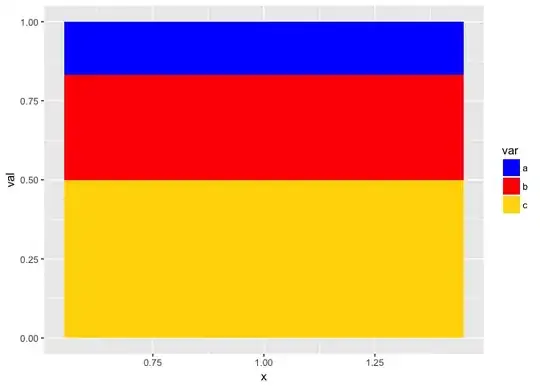
ggplot(df1,aes(1,val,fill=var)) + geom_bar(stat="identity",position="fill")
ggplot(df2,aes(1,val,fill=var)) + geom_bar(stat="identity",position="fill")
How can I fix this ?