1

I have a dataframe with 3 columns. I would like to plot col1 on the x axis with col2 and col3 on the y axis. Col1 has repeating values, so for each x value there are duplicate y values.

Example dataframe:

DF = pd.DataFrame({"name": ["Alice", "Alice", "Charles", "Charles", "Kumar", "Kumar"],
              "height": [124, 126, 169, 170, 175, 174],
              "weight": [100, 105, 123, 125, 139, 140]})

DF 

    name    height  weight
  0 Alice   124     100
  1 Alice   126     105
  2 Charles 169     123
  3 Charles 170     125
  4 Kumar   175     139
  5 Kumar   174     140

I want:

A) each person to occur only once on the x axis

B) keep all heights one color and all weights another color, with an accurate, non-repeating legend

So far I can get either A or B, not both. Below is what I'm trying and the output. For A, this was helpful (Python Scatter Plot with Multiple Y values for each X)

For A:

f = DF.groupby("name", as_index=False).agg({"height":lambda x: tuple(x), "weight":lambda x: tuple(x)})
for x, (y1, y2) in enumerate(zip(f.height.values.tolist(), f.weight.values.tolist()), start=1):

    plt.scatter([x] * len(y1), y1, color='green', marker='o', label="height")
    plt.scatter([x] * len(y2), y2, color='blue', marker='o', label="weight")

plt.xticks(np.arange(1, len(f.name.values) +1))
plt.axes().set_xticklabels(f.name.values.tolist())
plt.legend(loc="best")
plt.show()

For B:

ax = DF.plot(style="o", figsize=(7, 5), xlim=(-1, 6))
ax.set_xticks(DF.index)
ax.set_xticklabels(DF.name, rotation=90)
plt.show()

enter image description here

enter image description here

Chinntimes
  • 185
  • 1
  • 1
  • 8

2 Answers2

3

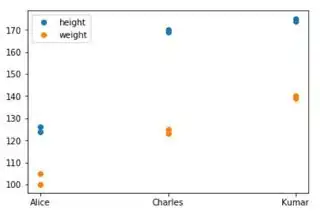
Because you have 2 columns you may plot 2 scatter plots, each with its own label.

import pandas as pd
import matplotlib.pyplot as plt

df = pd.DataFrame({"name": ["Alice", "Alice", "Charles", "Charles", "Kumar", "Kumar"],
              "height": [124, 126, 169, 170, 175, 174],
              "weight": [100, 105, 123, 125, 139, 140]})

plt.scatter(df.name, df.height, label="height")
plt.scatter(df.name, df.weight, label="weight")
plt.legend()
plt.show()

enter image description here

Having more columns, you may of course loop over them

for col in ["height", "weight"]:
    plt.scatter(df.name, df[col], label=col)
ImportanceOfBeingErnest
  • 321,279
  • 53
  • 665
  • 712
1

One simple option is to plot directly with matplotlib, instead of using the pandas.DataFrame.plot method. In order to have a solution independent of the number of columns and rows and so on, the 'name' column can be set to index. There is no need to loop over the columns. Thus, the code would be:

DF.set_index('name',inplace=True)
plt.plot(DF.index,DF.values,'o')
plt.legend(DF.columns)

Which generates:

plot1

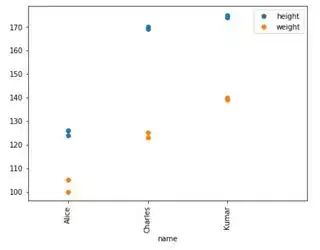
Another alternative is to adapt option B by replacing the string values (which are not used for plotting, instead the index is, which is why they are not at the same place) for integer values.

x_labels = DF['name'].drop_duplicates()
map_x_vals = {v: k for k, v in x_labels.to_dict().items()}
ax = DF.replace({'name' : map_x_vals}).plot(x='name',style="o", figsize=(7, 5), xlim=(-1, 6))
ax.set_xticks(x_labels.index)
ax.set_xticklabels(x_labels.values, rotation=90)
plt.show()

In order to get a good mapping, the inverse mapping between index and name after droping duplicates is used, and for the ticks and ticklabels, this same values are also used.

Note that the replace is performed before the plot and it is not stored, therefore, DF is not modified.

The generated plot is the following:

plot2

OriolAbril
  • 7,315
  • 4
  • 29
  • 40