I read some parameters from a text file using the following code:
H, OD, c, b, orc = np.genfromtxt('textfile.txt', unpack = True)
I plot them two by two using the simple code
plt.plot(H[i], c[i], 'bo')
Finally we have 10 plots for these 5 parameters. The plots are something like solid circle or solid elliptic or a closed solid figure using 300,000 points. similar to

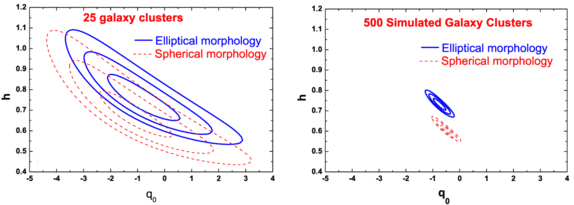
How could I plot the boundary line or fit line, I mean the outer line surrounded the figure. similar to

(source: springernature.com)