First I would like to apologize as I know I am not asking this question correctly (which is why I cant find what is likely a simple answer).
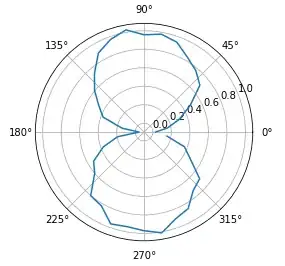
As you can see above the y axis it says 1e11 meaning that the units are in 100 Billions. I would like to change the graph to read 100 Billion instead of 1e11.
I am not sure what such a notation is called.
To be clear I am not asking to change the whole y axis to number values like other questions I only want to change the top 1e11 to be more readable to those who are less mathematical.
ax.get_yaxis().get_major_formatter().set_scientific(False)


