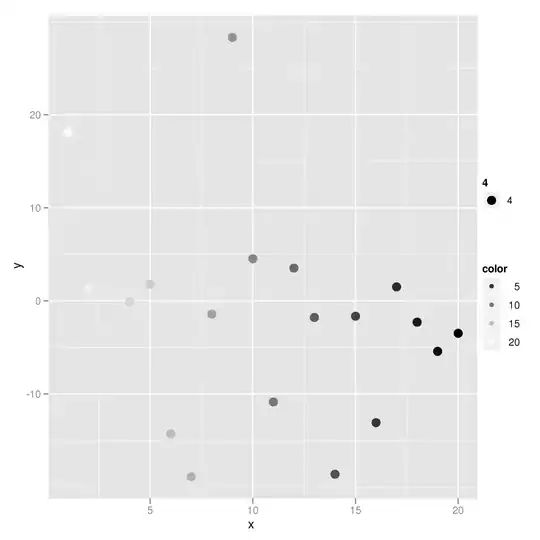
I am having trouble getting the line sizes in my freqpoly plot a little thicker. When I use aes(size = 1, ...), the lines become way to thick and "1" is not interpreted as the size in millimeters.
Here's the code for my plot:
library(ggplot2)
ggplot(data = test4) + geom_freqpoly(aes(size= 4, x=value, color = variable), binwidth = 25, boundary=-0.5)  +
  ggtitle("Freqpoly plot") + labs(y = "Count", x="Length") +
  scale_color_brewer("Species", palette = "Set2") +
  scale_x_continuous(breaks = seq(0,4000,500), labels = c("0", "500","1000","1500","2000","2500",
                                                          "3000","3500",">4000"))+
  scale_y_continuous(breaks = seq(0,1400,100)) +
  theme_linedraw(base_size = 18)+
  theme(plot.title = element_text(hjust = 0.5),
        axis.title.x = element_text(margin = margin(25,15,15,15,"pt")),
        axis.title.y = element_text(margin = margin(15,15,15,15,"pt"))) +
  theme(legend.text = element_text(face = "italic"))
And test looks like:
   variable value
1    C.rip   574
2    C.rip   269
3    C.rip   111
4    C.rip    79
5    C.rip   504
6    C.rip   252
The plots end up like this, (with aes(size..) and without:
Most of the answers I found for other questions were only for geom_line or geom_point.
Whats the correct way to increase line size here?

