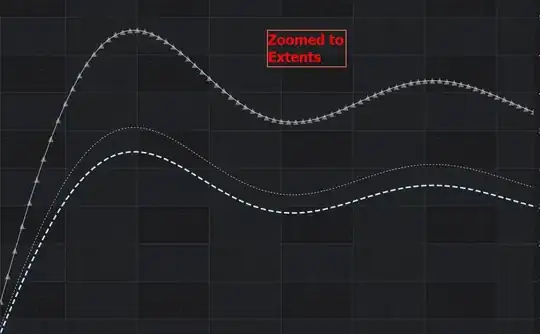
Great question, I'm afraid the answer is no, SciChart does not provide the feature of equally spacing data-point markers out of the box. They are, as you pointed out, tied to a data-point.
However, SciChart does provide the ability to create a custom series to draw whatever you want.
In the example/article above there are code samples to show you how to render a PointMarker in a custom series.
A worked example is found below for a CustomRenderableSeries which draws a PointMarker using the RenderContext API. This is no different from our Scatter series, but shows some of the internals of how this API works
public class CustomPointRenderableSeries : CustomRenderableSeries
{
    protected override void Draw(IRenderContext2D renderContext, IRenderPassData renderPassData)
    {
        base.Draw(renderContext, renderPassData);

        // Get the CustomPointRenderableSeries.PointMarker to draw at original points
        // Assumes you have declared one in XAML or code
        //
        // e.g. CustomPointRenderableSeries.PointMarker = new EllipsePointMarker();
        //
        var pointMarker = base.GetPointMarker();
        if (pointMarker != null)
        {
            // The resampled data for this render pass
            var dataPointSeries = renderPassData.PointSeries;

            var xCalc = renderPassData.XCoordinateCalculator;
            var yCalc = renderPassData.YCoordinateCalculator;

            // Begin a batched PointMarker draw operation
            pointMarker.BeginBatch(renderContext, pointMarker.Stroke, pointMarker.Fill);

            // Iterate over the data
            for (int i = 0; i < dataPointSeries.Count; i++)
            {
                // Convert data to coords
                double xCoord = xCalc.GetCoordinate(dataPointSeries.XValues[i]);
                double yCoord = yCalc.GetCoordinate(dataPointSeries.YValues[i]);
                int dataIndex = dataPointSeries.Indexes[i];

                // Draw at current location
                pointMarker.MoveTo(renderContext, xCoord, yCoord, dataIndex);
            }

            // End the batch
            // Note: To change point color, start a new batch
            pointMarker.EndBatch(renderContext);
        }
    }
}
So you could, theoretically, modify this example to space the X-coord at a fixed interval as opposed to at the dataPointSeries.XValues[i].
Note that this code loops over the dataPointSeries.Count which is the X,Y values in the viewport. If you want to place extra point-markers between data-points then you will need to interpolate somehow the Y-values.
That's an exercise to the reader, but how to interact with SciChart's library to create custom series is possible using the above.


