1

I'd like to understand the difference between an analytic and numeric FT of a function, using the numpy.fft module (i.e. why they are not the same). Starting with the equation

sig(x) = exp(-mod(x)),

signal plot

the Fourier Transform of this can be shown to give an analytical FT (see e.g. Arfken, Weber and Harris p966, or sympy: fourier_transform(exp(-abs(x)), x, k) which is a factor of 2 * pi different):
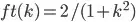
ft(k) = 2 / (1 + k**2).

Using python/numpy to calculate the FFT of sig = np.exp(-np.abs(x)) gives a numerical FT that can plotted against the analytic solution (ft_numeric ~= ft_analytic x wave in plot).

FT plot

The analytical FT can be seen to be a bounding window function for the numerical FT, and can be turned in to the numerical FT by multiplying by a suitable cos function (ft_analytic x wave overlaps ft_numeric, see example code for form of function).

My question is why does this numpy FFT produce a modified (modulated by a cos wave) numerical FT in this case? Is this to do with how the FFT is defined, and how can I tell this from its description: numpy FFT implementation.

import numpy as np
import numpy.fft as fft
import pylab as plt

x = np.linspace(-10, 10, 2001)
dx = x[1] - x[0]
normalization = 1 / dx

k = 2 * np.pi * fft.fftshift(fft.fftfreq(x.shape[0], d=dx))

# Signal.
sig = np.exp(-np.abs(x))

# Both shifted.
ft_numeric = fft.fftshift(fft.fft(sig))
ft_analytic = 2 / (1 + k**2)

wave = np.cos(2 * np.pi * k / (k[2] - k[0]))

plt.figure(1)
plt.clf()
plt.title('signal')
plt.plot(x, sig)
plt.xlabel('x')

plt.figure(2)
plt.clf()
plt.title('FT')
plt.plot(k, ft_analytic.real, label='ft_analytic')
plt.plot(k, normalization * ft_numeric, label='ft_numeric')
plt.plot(k, normalization * ft_numeric * wave, label='ft_analytic x wave')
plt.xlim((-15, 15))
plt.xlabel('k')
plt.legend()

plt.show()
markmuetz
  • 9,334
  • 2
  • 32
  • 33
  • There seems to be a fundamental misunderstanding. There is no cos modulation. You are just plotting the real part of the signal of your numeric FFT and the magnitude of your analytic. – Kaveh Vahedipour May 25 '18 at 11:39
  • 1
    The question linked answers your question. What you see is because your input signal is shifted by half a period. This creates a phase shift of `i*pi*k`. You need to use `ifftshift` on the input signal before applying `fft`. – Cris Luengo May 25 '18 at 14:20
  • @CrisLuengo you are right - if I use `ifftshift` first then the FT works as it should do. I guess that I should use this method if the domain of the input signal is symmetric about zero? However, there's nothing in the `numpy.fft`module documentation that I can see that says to do this. Perhaps you should just know this? Not sure this question is a duplicate because it's using a different library, in a different language and about a different function although admittedly the underlying fix is the same. – markmuetz May 25 '18 at 21:21
  • I think the concept is explained there: the origin must be the first sample of the input vector to FFT. You have the origin in the middle, hence the FFT thinks it is shifted by half a period. The signal is assumed periodic, it has nothing to do with symmetry, this is true for any signal. But the FFT (actually DFT) always does periodic signals, the input vector is one period. This is fundamentally different from the FT. – Cris Luengo May 25 '18 at 21:38

1 Answers1

1

There seems to be a fundamental misunderstanding. There is no cos modulation. You are just plotting the real part of the signal of your numeric FFT and the magnitude of your analytic.
The real part is obviously mirrored around 0 as you are dealing with a real signal. Thus the cosine.

Kaveh Vahedipour
  • 3,412
  • 1
  • 14
  • 22
  • You are right! I am stupid. Many thanks. – markmuetz May 25 '18 at 11:50
  • 1
    Change `ft_analytic.real` to `np.abs(ft_analytic)` and it looks good. – markmuetz May 25 '18 at 12:04
  • 1
    This is wrong. The analytical solution is purely real, OP is not "just plotting the real part", there is no imaginary part. The numerical result does have an imaginary part, and it is caused by a shift in the input signal. Justs throwing away the phase is not correct, even if it seems to give the right result here. If the analytical solution had a non-zero phase anywhere, this solution would fail. The right solution is to use `ifftshift` on the input signal before `fft`. – Cris Luengo May 25 '18 at 14:23
  • I retract my earlier comment. There is, as Cris says, no reason why I should use the `np.abs` value (this had been bothering me - the FT of an even function should be purely real). If, as Cris suggests, I pre-shift the signal using `ifftshift` it works as expected (i.e. plotting the real part of the FT is the same as the analytical solution). Thanks Cris. – markmuetz May 25 '18 at 21:01