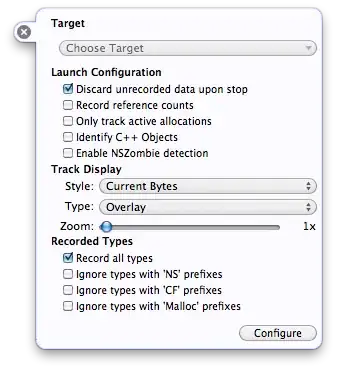
I'm getting mixed info regarding the GRAPH of the Object Alloc tool in Instruments...
On one hand, I've heard several people claim (<-- see thread) that the graph doesn't take deallocations into account and it will always rise. Yet when I use it myself, I can see that it sometimes DOES go down, particularly when I release a resource. So, can someone please tell me what the heck I am looking at when I see the graph in the Object Alloc tool?
And if you, too, are going to re-assert the well-spread claim that the graph indeed does not take deallocations into account, please do us laypeople a favor and be very thorough in your explanation -- taking special care to address exactly what you assume the graph to be doing when it does go DOWN, and it does.
*Refer to the answer in this thread:
Checking memory allocation in Instruments
