I want to plot some scatter plots over the map of a country (an image). The idea is to depict the data visualization of the area at which the plot is plotted.
So, this is how I plot the image of the map of USA, where the circles I have drawn towards the top left and the middle are where I would like to display my scatter plots:
import numpy as np
import matplotlib.pyplot as plt
fig=plt.figure(figsize=(10,15))
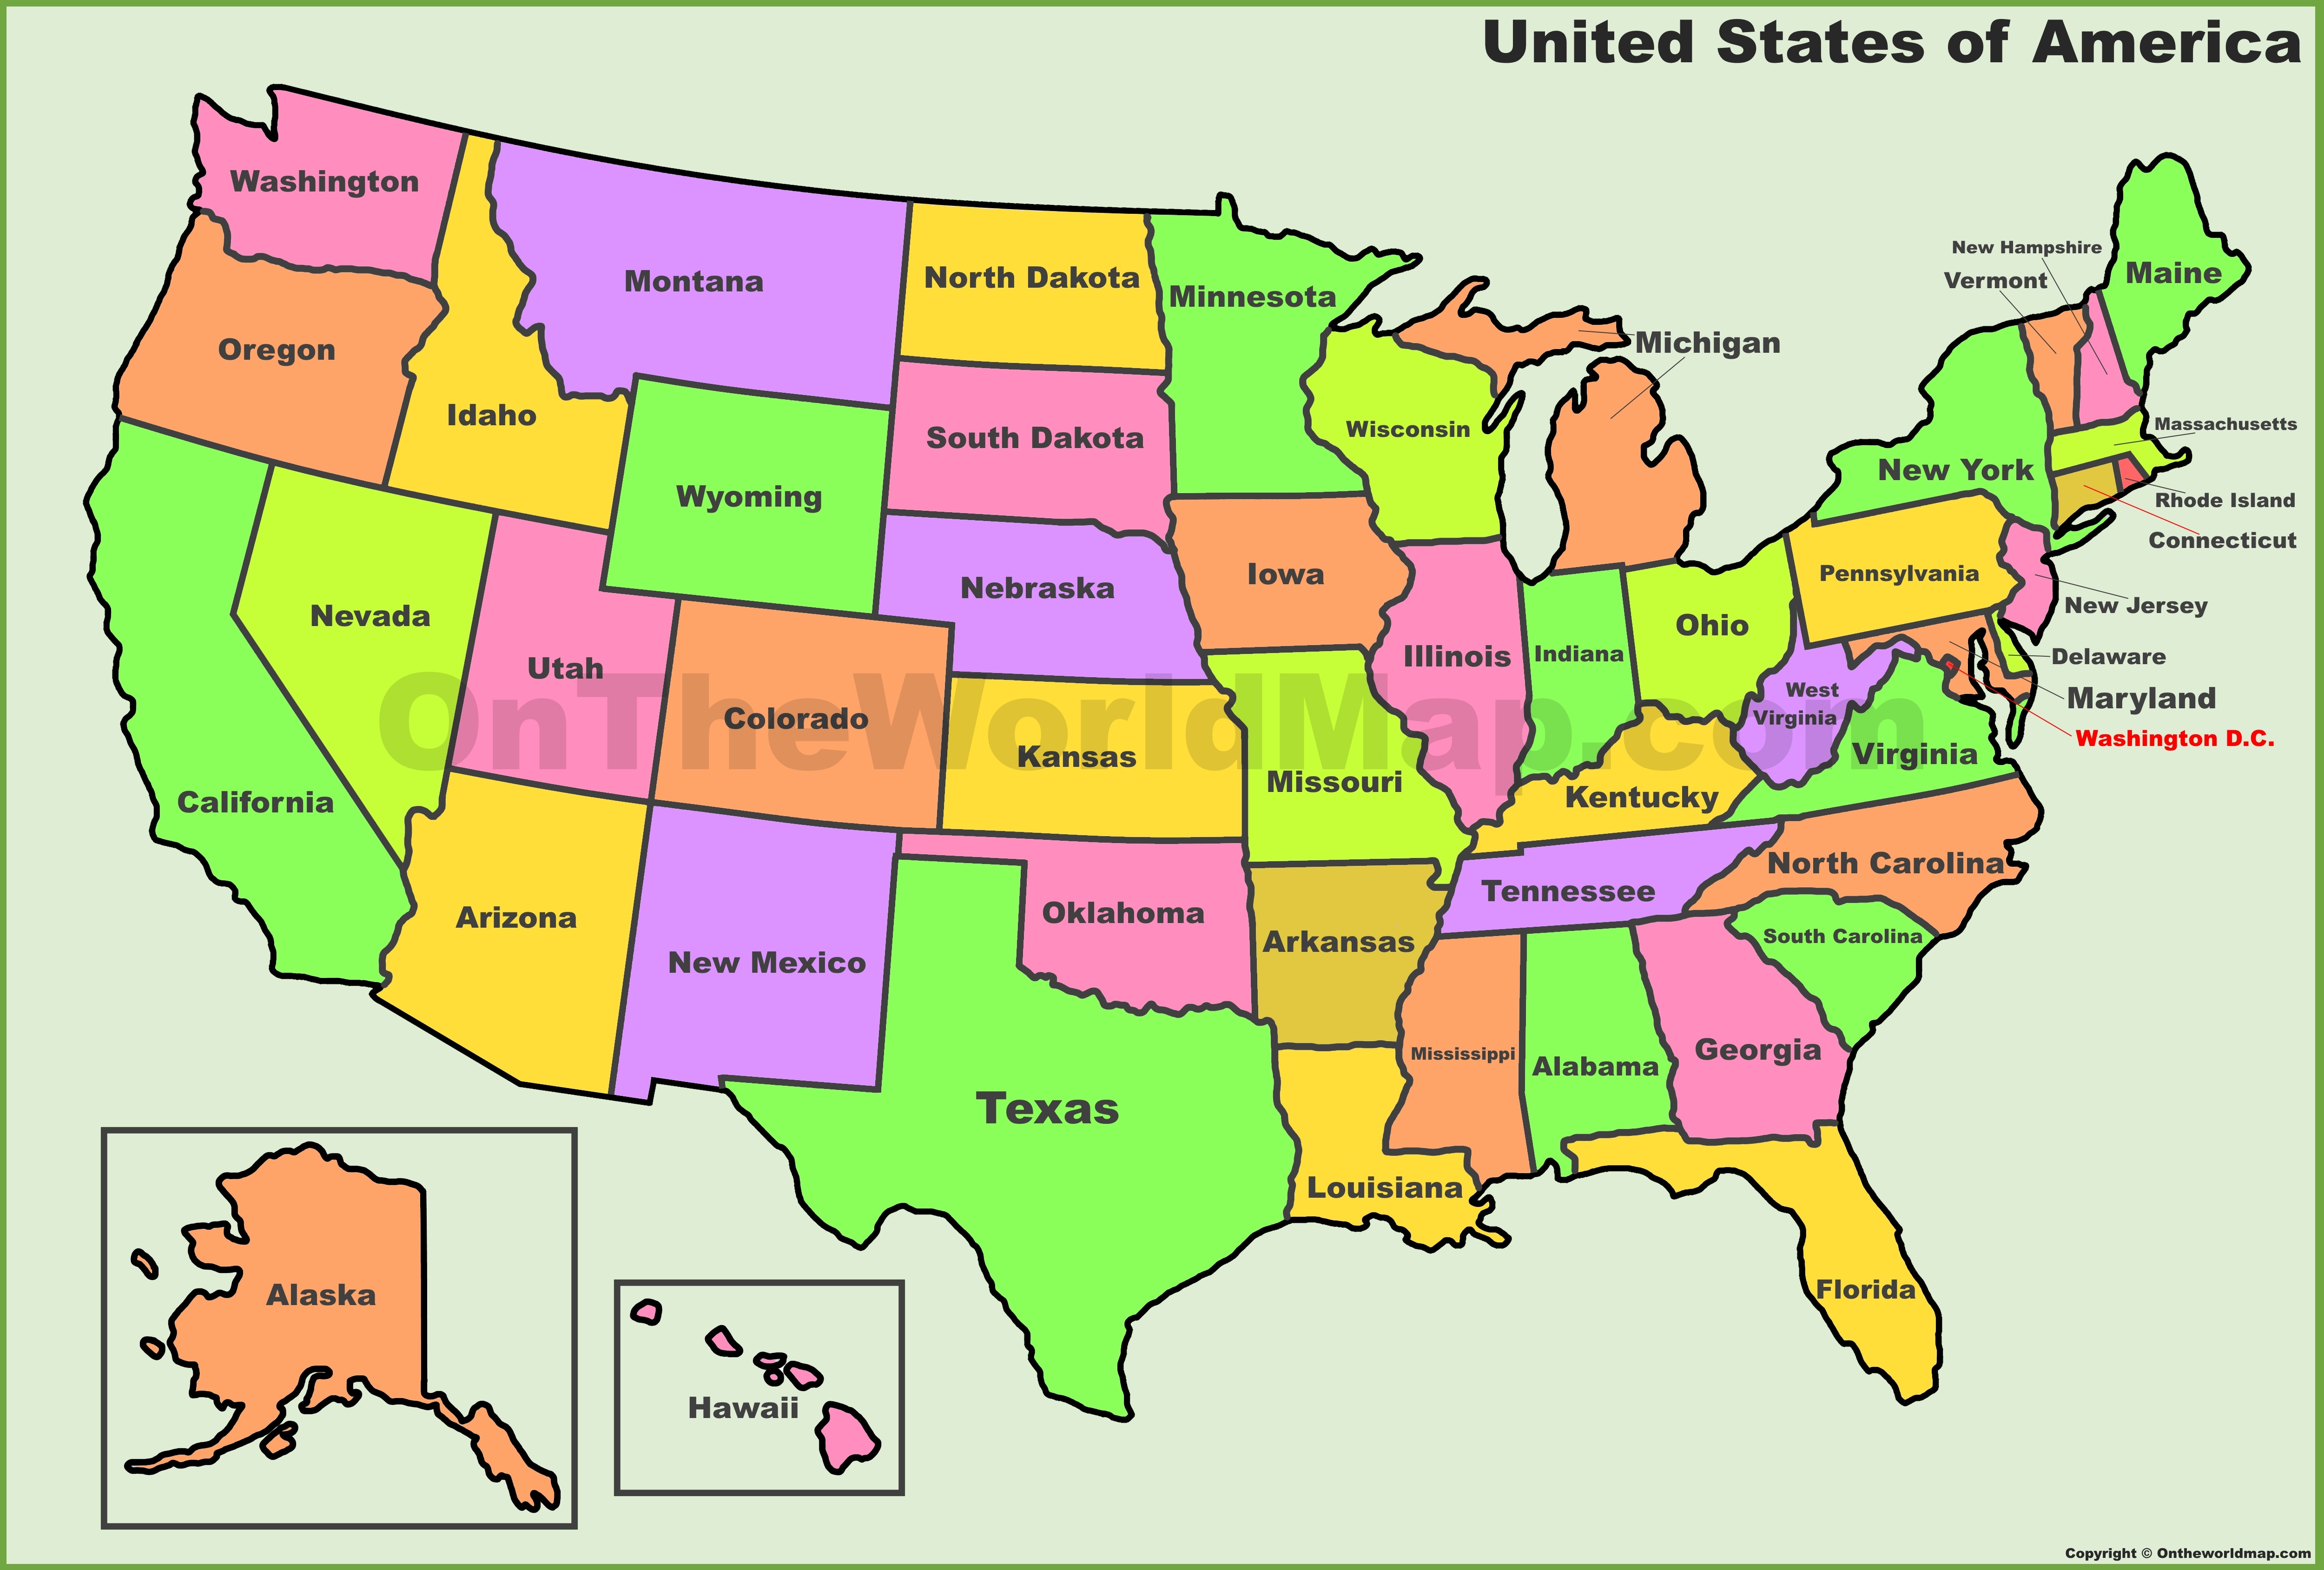
im = plt.imread("usa-states-map.jpg")
implot = plt.imshow(im, extent=[0, 200, 0, 150])
# A circle in the upper left region
theta=np.linspace(0,2*np.pi,50)
faux_radius = 15
z=np.cos(theta)*faux_radius + 45
t=np.sin(theta)*faux_radius + 130
plt.plot(z,t)
# A circle in the middle region
theta=np.linspace(0,3*np.pi,50)
faux_radius = 15
z=np.cos(theta)*faux_radius + 100
t=np.sin(theta)*faux_radius + 80
plt.plot(z,t)
This plots the image like so:

I proceed to plot the scatter plots like so:
import numpy as np
import matplotlib.pyplot as plt

fig=plt.figure(figsize=(10,15))

im = plt.imread("usa-states-map.jpg")
implot = plt.imshow(im, extent=[0, 200, 0, 150])

# A circle in the upper left region
theta=np.linspace(0,2*np.pi,50)
faux_radius = 15
z=np.cos(theta)*faux_radius + 45
t=np.sin(theta)*faux_radius + 130
plt.plot(z,t)

# A circle in the middle region
theta=np.linspace(0,3*np.pi,50)
faux_radius = 15
z=np.cos(theta)*faux_radius + 100
t=np.sin(theta)*faux_radius + 80
plt.plot(z,t)

# Scatter plot 1
ax1 = plt.subplot(2,2,1)
ax1.scatter(x_1_a, y_1_a, marker="s")
ax1.scatter(x_1_b, y_1_b, marker="o")

# Scatter plot 2
ax1 = plt.subplot(2,2,2)
ax1.scatter(x_2_a, y_2_a, marker="s")
ax1.scatter(x_2_a, y_2_b, marker="o")
But the output it produces does not display the background image, and only plots the scatter plots:
[ ]
]
I even tried using zorder which is supposed to tell matplotlib which plot should come on top and which on bottom, but to no avail - it produces the same output as above:
implot = plt.imshow(im, extent=[0, 200, 0, 150], zorder=1)
...
...
...
# Scatter plot 1
ax1 = plt.subplot(2,2,1)
ax1.scatter(x_1_a, y_1_a, marker="s", zorder=2)
ax1.scatter(x_1_b, y_1_b, marker="o", zorder=2)

# Scatter plot 2
ax1 = plt.subplot(2,2,2)
ax1.scatter(x_2_a, y_2_a, marker="s", zorder=3)
ax1.scatter(x_2_a, y_2_b, marker="o", zorder=3)
How do I fix this to get the desired result? I don't even need the 2 circles to be present on the map actually - those were just to illustrate where I would like to plot the 2 scatter plots. Thanks.
