I have the following data:
d <- data.frame(id = rep(2,6), type = c(letters[1:6]), abund = c(27.3,2.7,2.3,2.1,1.2,0.3))

  id type abund
1  2    a  27.3
2  2    b   2.7
3  2    c   2.3
4  2    d   2.1
5  2    e   1.2
6  2    f   0.3
I want to create a stacked barplot in ggplot, but when I try it doesn't work correctly:
 library(ggplot2)

 ggplot(data = d, aes(x = abund, y = factor(id), fill = factor(type))) +
    theme_bw() + geom_bar(stat='identity')
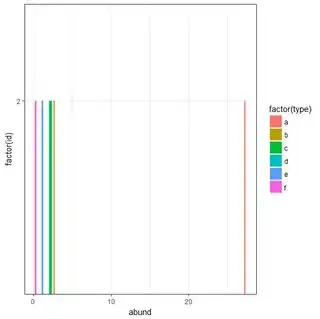
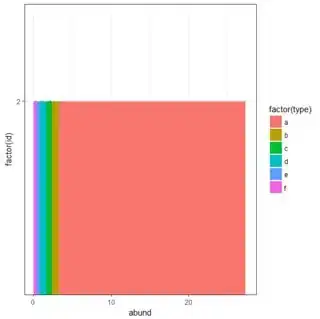
What I get (LEFT) and [conceptually*] what I want (RIGHT):
I've tried moving around aesthetics and playing with factors, but nothing has worked. This post seemed most similar to mine after an extensive search, but my problem is different.
What do I do??
*I say conceptually, because I drew this in ms paint. I want it to look like a typical ggplot stacked barchart.
Note: my actual desired end result is to have stacked barplots for multiple id groups (i.e., so I have id = rep(2:6, each = 6) using my example)


