2

I am producing a graph

using python matplotlib with a line color gradient and colorbar

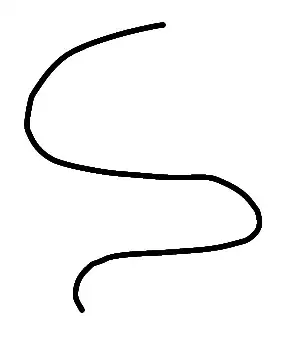
Everything seems fine but in higher resolution one can notice the breaks between line segments as in next image:

Is there any way to smooth out this graph? I figured one could perhaps artificially increase the number of data points in the vulnerable areas of joints but I was not able to implement it successfully.

eyllanesc
  • 235,170
  • 19
  • 170
  • 241
Arn
  • 1,898
  • 12
  • 26
  • 2
    Please consider adding a code sample, or revising the one you posted in this question. As it currently stands, its formatting and scope make it hard for us to help you; here is a [great resource](http://stackoverflow.com/help/mcve) to get you started on that. Good luck with your code! – Reblochon Masque Jul 06 '18 at 05:37
  • 1
    [This answer](https://stackoverflow.com/a/47856091/4124317) would show a possible way of "smoothing" by increasing the number of points drawn. It may get you started. For this question to be answered, following the above comment would still make sense. – ImportanceOfBeingErnest Jul 06 '18 at 10:22

0 Answers0