Heyho,
there is a problem in the plot of R. you´ll see it on the picture
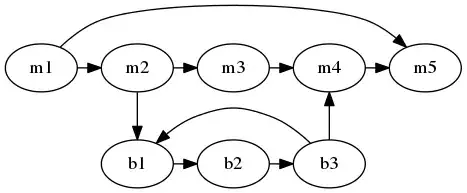 - Lines between multiple datasets
The base of the plot is a CSV-file, which includes 47 loops á 101 measurements.
How could I delete or hide these lines between these different graphs?
lw1 <- read.csv("psip_Leitungswasser_240718.csv", sep = ",", skip = 28)[ ,2:8]
ls(lw1)
str(lw1)
summary(lw1)
lwfr1 <- lw1$Frequency.Hz.
lwohm1 <- lw1$Impedance.Ohms.
plot(lwfr1,lwohm1, log = "x",type="l", col="blue", ylab = "Impedance in Ohm",axes=FALSE,
 main = "Impedance of water",
 xlab = "Frequency in Hz" )
labels <- c(0.1,1,10,100,1000,10000)
axis(side=1, at=labels, labels=labels)
axis(side=2, at=seq(200.5, 204.5, by=1))
grid(nx=5)
box()
the new code:
lw1 <- read.csv("psip_Leitungswasser_240718.csv", sep = ",", skip = 28)[ ,2:8]
lwfr1 <- lw1$Frequency.Hz.
lwohm1 <- lw1$Impedance.Ohms.
Loop <- lw1$Loop
dat <- do.call(rbind, lapply(1:1, function(a) data.frame(x=lwfr1, y=lwohm1,
grp=Loop)))
with(do.call(rbind, by(lw1, dat$Loop, function(d) { as.data.frame(lapply(d,
`length<-`, nrow(d))); })),
plot(lwfr1,lwohm1, log = "x",type="l", col="blue", ylab = "Widerstand in
Ohm",axes=FALSE,
 main = "Frequenzabhängiger Widerstand \n von Leitungswasser",
 xlab = "Frequenz in Hz" ))
labels <- c(0.1,1,10,100,1000,10000)
axis(side=1, at=labels, labels=labels)
axis(side=2, at=seq(200.5, 204.5, by=1))
grid(nx=5)
box()
but there is an error when i run
with(do.call(rbind, by(lw1, dat$Loop, function(d) { as.data.frame(lapply(d,
`length<-`, nrow(d))); })),
plot(lwfr1,lwohm1, log = "x",type="l", col="blue", ylab = "Widerstand in
Ohm",axes=FALSE,
 main = "Frequenzabhängiger Widerstand \n von Leitungswasser",
 xlab = "Frequenz in Hz" ))

Error in names(IND) <- deparse(substitute(INDICES))[1L] :
  'names' attribute [1] must be the same length as the vector [0]
sample of the codeblock
    OE PSIP Measurement,
PSIP_Version,1.0.1,
Seperator,Comma,
Operator,psip_user,
Description,O&E PSIP Measurement File.
Date,24/07/2018,
Time,15:34:06,
Instance,00
***End_Of_Header***,
User_Comment,Saba Ody,
Current Resistor[Ohms],100.000000,
Stimulus Channel Num,1,
Response Channel Nums,1,
Frequency Sweep(in Hz),Start,0.100000,Stop,10000.000000,
Number of Steps,101,
Amplitude(Volts),1.000000,
Settle Time(Secs),1.000000,Cycle,1,
Integration Time(Secs),5.000000,Cycle,5,
Master/Slave Sel,None,
External Trigger Sel,None,


Date,24/07/2018,
Time,15:34:06,
Y_Unit_Label,Hz,ratio,rad,
X_Dimension,Time,Time,Time,
***End_Of_Header***,
,,,Chan-1,Chan-1,Chan-1,
X_Value,AO_sampling_rate,Frequency[Hz],Magnitude[ratio],Phase_Shift[rad],Impedance[Ohms],TimeStamp[Sec],Loop,Comment
,100000,0.100000,2.033632,0.000102,203.363212,66,1
,100000,0.112202,2.033585,0.000061,203.358531,127,1
,100000,0.125893,2.033528,0.000049,203.352751,182,1
,100000,0.141254,2.033456,0.000006,203.345597,232,1
,100000,0.158489,2.033413,0.000008,203.341263,277,1
,100000,0.177828,2.033370,-0.000017,203.337043,317,1
,100000,0.199526,2.033342,-0.000011,203.334191,353,1
,100000,0.223872,2.033264,-0.000045,203.326415,386,1
,100000,0.251189,2.033279,-0.000070,203.327909,415,1
,100000,0.281838,2.033281,-0.000085,203.328123,442,1
,100000,0.316228,2.033244,-0.000100,203.324420,466,1
,100000,0.354813,2.033261,-0.000114,203.326130,488,1
,100000,0.398107,2.033311,-0.000155,203.331097,508,1
,100000,0.446684,2.033269,-0.000187,203.326936,526,1
,100000,0.501187,2.033287,-0.000236,203.328676,542,1
,100000,0.562341,2.033296,-0.000278,203.329551,557,1
,100000,0.630957,2.033302,-0.000326,203.330213,571,1
,100000,0.707946,2.033292,-0.000386,203.329175,584,1
,100000,0.794328,2.033294,-0.000461,203.329448,596,1
,100000,0.891251,2.033259,-0.000531,203.325853,607,1
,100000,1.000000,2.033220,-0.000601,203.322022,618,1
,100000,1.122018,2.033179,-0.000676,203.317869,628,1
,100000,1.258925,2.033100,-0.000766,203.309994,638,1
,100000,1.412538,2.032995,-0.000870,203.299512,648,1
,100000,1.584893,2.032906,-0.000963,203.290588,658,1
,100000,1.778279,2.032782,-0.001066,203.278181,668,1
,100000,1.995262,2.032613,-0.001165,203.261301,678,1
,100000,2.238721,2.032433,-0.001263,203.243286,688,1
,100000,2.511886,2.032219,-0.001373,203.221853,698,1
,100000,2.818383,2.032003,-0.001469,203.200256,708,1
,100000,3.162278,2.031741,-0.001573,203.174129,718,1
,100000,3.548134,2.031465,-0.001676,203.146503,728,1
,100000,3.981072,2.031164,-0.001767,203.116376,738,1
,100000,4.466836,2.030831,-0.001857,203.083104,748,1
,100000,5.011872,2.030483,-0.001934,203.048260,758,1
,100000,5.623413,2.030110,-0.002009,203.011001,768,1
,100000,6.309574,2.029722,-0.002078,202.972223,778,1
,100000,7.079458,2.029316,-0.002131,202.931644,788,1
,100000,7.943282,2.028905,-0.002173,202.890491,798,1
,100000,8.912509,2.028480,-0.002204,202.848010,808,1
,100000,10.000000,2.028051,-0.002229,202.805076,818,1
,100000,11.220185,2.027617,-0.002234,202.761698,828,1
,100000,12.589254,2.027180,-0.002228,202.718043,838,1
,100000,14.125376,2.026749,-0.002215,202.674873,848,1
,100000,15.848932,2.026331,-0.002191,202.633141,858,1
,100000,17.782794,2.025915,-0.002153,202.591509,868,1
,100000,19.952623,2.025515,-0.002109,202.551528,878,1
,100000,22.387212,2.025126,-0.002052,202.512559,888,1
,100000,25.118865,2.024756,-0.001991,202.475573,898,1
,100000,28.183830,2.024401,-0.001924,202.440077,908,1
,100000,31.622777,2.024071,-0.001852,202.407074,918,1
,100000,35.481339,2.023752,-0.001774,202.375184,928,1
,100000,39.810717,2.023455,-0.001693,202.345536,938,1
,100000,44.668360,2.023177,-0.001608,202.317667,948,1
,100000,50.118724,2.022808,-0.001630,202.280806,958,1
,100000,56.234133,2.022681,-0.001442,202.268050,968,1
,100000,63.095735,2.022456,-0.001357,202.245617,978,1
,100000,70.794579,2.022250,-0.001270,202.225025,988,1
,100000,79.432824,2.022066,-0.001189,202.206588,998,1
,100000,89.125094,2.021894,-0.001110,202.189419,1008,1
,100000,100.000001,2.021720,-0.001029,202.171968,1018,1
,100000,112.201846,2.021600,-0.000953,202.159982,1028,1
,100000,125.892542,2.021469,-0.000882,202.146862,1038,1
,100000,141.253755,2.021354,-0.000811,202.135423,1048,1
,100000,158.489320,2.021247,-0.000741,202.124720,1058,1
,100000,177.827942,2.021153,-0.000679,202.115341,1068,1
,100000,199.526233,2.021073,-0.000616,202.107254,1078,1
,100000,223.872115,2.020996,-0.000559,202.099608,1088,1
,100000,251.188644,2.020925,-0.000504,202.092483,1098,1
,100000,281.838294,2.020865,-0.000449,202.086528,1108,1
,100000,316.227767,2.020805,-0.000398,202.080524,1118,1
,100000,354.813391,2.020755,-0.000352,202.075485,1128,1
,100000,398.107172,2.020710,-0.000303,202.071040,1138,1
,100000,446.683594,2.020667,-0.000261,202.066711,1148,1
,100000,501.187236,2.020626,-0.000217,202.062553,1158,1
,100000,562.341327,2.020590,-0.000176,202.058988,1168,1
,100000,630.957347,2.020560,-0.000134,202.056012,1178,1
,100000,707.945787,2.020524,-0.000092,202.052389,1188,1
,100000,794.328237,2.020498,-0.000053,202.049770,1198,1
,100000,891.250941,2.020472,-0.000014,202.047163,1208,1
,100000,1000.000003,2.020449,0.000033,202.044897,1218,1
,100000,1122.018457,2.020414,0.000077,202.041393,1228,1
,100000,1258.925415,2.020394,0.000124,202.039437,1238,1
,100000,1412.537548,2.020379,0.000173,202.037904,1248,1
,100000,1584.893196,2.020351,0.000223,202.035064,1258,1
,100000,1778.279414,2.020332,0.000277,202.033150,1268,1
,100000,1995.262319,2.020311,0.000337,202.031094,1278,1
,100000,2238.721143,2.020289,0.000403,202.028866,1288,1
,100000,2511.886436,2.020273,0.000478,202.027350,1298,1
,100000,2818.382936,2.020258,0.000552,202.025830,1308,1
,100000,3162.277665,2.020233,0.000634,202.023341,1318,1
,100000,3548.133897,2.020215,0.000733,202.021463,1328,1
,100000,3981.071710,2.020209,0.000837,202.020871,1338,1
,100000,4466.835926,2.020173,0.000949,202.017311,1348,1
,100000,5011.872341,2.020169,0.001084,202.016912,1358,1
,100000,5623.413256,2.020138,0.001223,202.013776,1368,1
,100000,6309.573449,2.020134,0.001385,202.013379,1378,1
,100000,7079.457847,2.020103,0.001565,202.010275,1388,1
,100000,7943.282350,2.020082,0.001760,202.008239,1398,1
,100000,8912.509383,2.020077,0.001984,202.007715,1408,1
,100000,10000.000000,2.020056,0.002236,202.005596,1418,1
,100000,0.100000,2.031601,0.000085,203.160094,1486,2
,100000,0.112202,2.031583,0.000046,203.158260,1547,2
,100000,0.125893,2.031546,0.000034,203.154623,1602,2
,100000,0.141254,2.031518,0.000012,203.151808,1652,2
,100000,0.158489,2.031514,-0.000012,203.151416,1697,2
,100000,0.177828,2.031530,-0.000017,203.152998,1737,2
,100000,0.199526,2.031516,-0.000018,203.151575,1773,2
,100000,0.223872,2.031523,-0.000033,203.152308,1806,2
,100000,0.251189,2.031549,-0.000079,203.154866,1835,2
,100000,0.281838,2.031538,-0.000090,203.153812,1862,2
,100000,0.316228,2.031568,-0.000113,203.156805,1886,2
,100000,0.354813,2.031618,-0.000133,203.161824,1908,2
,100000,0.398107,2.031629,-0.000154,203.162898,1928,2
,100000,0.446684,2.031643,-0.000206,203.164297,1946,2
,100000,0.501187,2.031672,-0.000225,203.167214,1962,2
,100000,0.562341,2.031698,-0.000287,203.169821,1977,2
,100000,0.630957,2.031678,-0.000337,203.167758,1991,2
,100000,0.707946,2.031720,-0.000389,203.172015,2004,2
,100000,0.794328,2.031707,-0.000469,203.170702,2016,2
,100000,0.891251,2.031695,-0.000518,203.169493,2027,2
,100000,1.000000,2.031661,-0.000605,203.166097,2038,2
,100000,1.122018,2.031613,-0.000693,203.161284,2048,2
,100000,1.258925,2.031539,-0.000776,203.153882,2058,2
,100000,1.412538,2.031444,-0.000869,203.144383,2068,2
,100000,1.584893,2.031352,-0.000959,203.135157,2078,2
,100000,1.778279,2.031219,-0.001067,203.121912,2088,2
,100000,1.995262,2.031072,-0.001160,203.107203,2098,2
,100000,2.238721,2.030894,-0.001276,203.089372,2108,2
,100000,2.511886,2.030693,-0.001372,203.069334,2118,2
,100000,2.818383,2.030464,-0.001473,203.046403,2128,2
,100000,3.162278,2.030213,-0.001571,203.021255,2138,2
,100000,3.548134,2.029935,-0.001677,202.993459,2148,2
,100000,3.981072,2.029626,-0.001764,202.962565,2158,2
,100000,4.466836,2.029309,-0.001856,202.930907,2168,2
,100000,5.011872,2.028966,-0.001933,202.896635,2178,2
,100000,5.623413,2.028596,-0.002013,202.859568,2188,2
,100000,6.309574,2.028216,-0.002075,202.821637,2198,2
,100000,7.079458,2.027802,-0.002131,202.780241,2208,2
,100000,7.943282,2.027391,-0.002175,202.739071,2218,2
,100000,8.912509,2.026966,-0.002202,202.696650,2228,2
,100000,10.000000,2.026531,-0.002225,202.653143,2238,2
,100000,11.220185,2.026101,-0.002235,202.610130,2248,2
,100000,12.589254,2.025671,-0.002230,202.567140,2258,2
,100000,14.125376,2.025236,-0.002215,202.523633,2268,2
,100000,15.848932,2.024816,-0.002190,202.481586,2278,2
,100000,17.782794,2.024401,-0.002151,202.440141,2288,2
,100000,19.952623,2.024008,-0.002108,202.400803,2298,2
,100000,22.387212,2.023620,-0.002054,202.361987,2308,2
,100000,25.118865,2.023243,-0.001991,202.324339,2318,2
,100000,28.183830,2.022895,-0.001924,202.289472,2328,2
,100000,31.622777,2.022560,-0.001849,202.256050,2338,2
,100000,35.481339,2.022244,-0.001775,202.224440,2348,2
,100000,39.810717,2.021951,-0.001692,202.195122,2358,2
,100000,44.668360,2.021679,-0.001609,202.167918,2368,2
,100000,50.118724,2.021334,-0.001655,202.133426,2378,2
,100000,56.234133,2.021179,-0.001441,202.117858,2388,2
,100000,63.095735,2.020955,-0.001355,202.095521,2398,2
,100000,70.794579,2.020754,-0.001270,202.075385,2408,2
,100000,79.432824,2.020567,-0.001188,202.056661,2418,2
,100000,89.125094,2.020395,-0.001107,202.039507,2428,2
,100000,100.000001,2.020230,-0.001021,202.022956,2438,2
,100000,112.201846,2.020097,-0.000953,202.009702,2448,2
,100000,125.892542,2.019963,-0.000882,201.996334,2458,2
,100000,141.253755,2.019849,-0.000810,201.984884,2468,2
,100000,158.489320,2.019747,-0.000741,201.974659,2478,2
,100000,177.827942,2.019651,-0.000679,201.965117,2488,2
,100000,199.526233,2.019566,-0.000616,201.956601,2498,2
,100000,223.872115,2.019487,-0.000558,201.948741,2508,2
,100000,251.188644,2.019420,-0.000503,201.941972,2518,2
,100000,281.838294,2.019352,-0.000450,201.935221,2528,2
,100000,316.227767,2.019292,-0.000400,201.929154,2538,2
,100000,354.813391,2.019244,-0.000352,201.924390,2548,2
,100000,398.107172,2.019194,-0.000305,201.919433,2558,2
,100000,446.683594,2.019152,-0.000260,201.915177,2568,2
,100000,501.187236,2.019108,-0.000217,201.910813,2578,2
,100000,562.341327,2.019076,-0.000175,201.907632,2588,2
,100000,630.957347,2.019038,-0.000135,201.903775,2598,2
,100000,707.945787,2.019007,-0.000093,201.900732,2608,2
,100000,794.328237,2.018973,-0.000054,201.897307,2618,2
,100000,891.250941,2.018940,-0.000010,201.894037,2628,2
,100000,1000.000003,2.018917,0.000032,201.891674,2638,2
,100000,1122.018457,2.018890,0.000076,201.889010,2648,2
,100000,1258.925415,2.018866,0.000124,201.886589,2658,2
,100000,1412.537548,2.018844,0.000174,201.884390,2668,2
,100000,1584.893196,2.018827,0.000225,201.882691,2678,2
,100000,1778.279414,2.018806,0.000279,201.880628,2688,2
,100000,1995.262319,2.018783,0.000338,201.878303,2698,2
,100000,2238.721143,2.018754,0.000403,201.875388,2708,2
,100000,2511.886436,2.018740,0.000475,201.873970,2718,2
,100000,2818.382936,2.018718,0.000552,201.871840,2728,2
,100000,3162.277665,2.018701,0.000636,201.870126,2738,2
,100000,3548.133897,2.018678,0.000735,201.867766,2748,2
,100000,3981.071710,2.018670,0.000837,201.866992,2758,2
,100000,4466.835926,2.018637,0.000951,201.863658,2768,2
,100000,5011.872341,2.018626,0.001085,201.862590,2778,2
,100000,5623.413256,2.018595,0.001222,201.859504,2788,2
,100000,6309.573449,2.018588,0.001386,201.858836,2798,2
,100000,7079.457847,2.018561,0.001566,201.856118,2808,2
,100000,7943.282350,2.018541,0.001762,201.854145,2818,2
,100000,8912.509383,2.018526,0.001985,201.852572,2828,2
,100000,10000.000000,2.018503,0.002236,201.850320,2838,2


