Some assumptions
You are asking how to do this in Excel, but your question is tagged R and Power BI (also RStudio, but that has been edited away), so I'm going to show you how to do this with R and Power BI. I'm also going to show you why you got that error message, and also why you would get an error message either way because your dataset is just not sufficient to make a correlation plot.
My answer
I'm assuming you would like to make a correlation plot of the population between the cities in your table. In that table you'd need more information than only one year for each city. I would check your data sources and see if you could come up with population numbers for, let's say, the last 10 years. In lack of the exact numbers for the cities in your table, I'm going to use some semi-made up numbers for the population in the 10 most populous countries (following your datastrutcture):
Country         2017        2016        2015        2014        2013
China           1415045928  1412626453  1414944844  1411445597  1409517397
India           1354051854  1340371473  1339431384  1343418009  1339180127
United States   326766748   324472802   325279622   324521777   324459463
Indonesia       266794980   266244787   266591965   265394107   263991379
Brazil          210867954   210335253   209297939   209860881   209288278
Pakistan        200813818   199761249   200253292   197655630   197015955
Nigeria         195875237   192568158   195757661   191728478   190886311
Bangladesh      166368149   165630262   165936711   166124290   164669751
Russia          143964709   143658415   143146914   143341653   142989754
Mexcio          137590740   137486490   136768870   137177870   136590740
Writing and debugging R code in Power BI is a real pain, so I would recommend installing R studio, write your little R snippets there, and then paste it into Power B.
The reason for your error message is that the function cor() onlyt takes numerical data as arguments. In your code sample the city names are given as arguments. And there are more potential traps in your code sample. You have to make sure that your dataset is numeric. And you have to make sure that your dataset has a shape that the cor() will accept.
Below is an R script that will do just that. Copy the data above, and store it in a file called data.xlsx on your C drive.
The Code
library(corrplot)
library(readxl)

# Read data
setwd("C:/")
data <- read_excel("data.xlsx")

# Set Country names as row index
rownames(data) <- data$Country

# Remove Country from dataframe
data$Country <- NULL

# Transpose data into a readable format for cor()
data <- data.frame(t(data))

# Plot data
corrplot(cor(data))
The plot

Power BI
In Power BI, you need to import the data before you use it in an R visual:
Copy this:
Country,2017,2016,2015,2014,2013
China,1415045928,1412626453,1414944844,1411445597,1409517397
India,1354051854,1340371473,1339431384,1343418009,1339180127
United States,326766748,324472802,325279622,324521777,324459463
Indonesia,266794980,266244787,266591965,265394107,263991379
Brazil,210867954,210335253,209297939,209860881,209288278
Pakistan,200813818,199761249,200253292,197655630,197015955
Nigeria,195875237,192568158,195757661,191728478,190886311
Bangladesh,166368149,165630262,165936711,166124290,164669751
Russia,143964709,143658415,143146914,143341653,142989754
Mexcio,137590740,137486490,136768870,137177870,136590740
Save it as countries.csv in a folder of your choosing, and pick it up in Power BI using
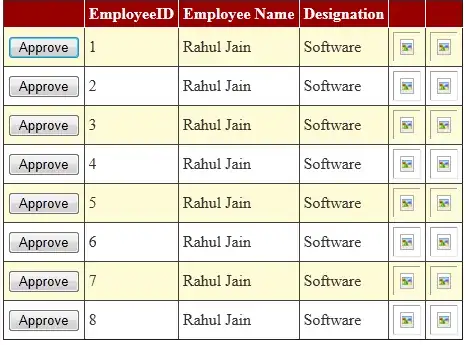
Get Data | Text/CSV, click Edit in the dialog box, and in the Power Query Editor, click Use First Row as headers so that you have this table in your Power Query Editor:

Click Close & Apply and make sure that you've got the data available under VISUALIZATIONS | FIELDS:
Click R under VISUALIZATIONS:
Select all columns under FIELDS | countries so that you get this setup:
Take parts of your R snippet that we prepared above
library(corrplot)

# Set Country names as row index
data <- dataset

rownames(data) <- data$Country

# Remove Country from dataframe
data$Country <- NULL

# Transpose data into a readable format for cor()
data <- data.frame(t(data))

# Plot data
corrplot(cor(data))
And paste it into the Power BI R script Editor:

Click Run R Script:

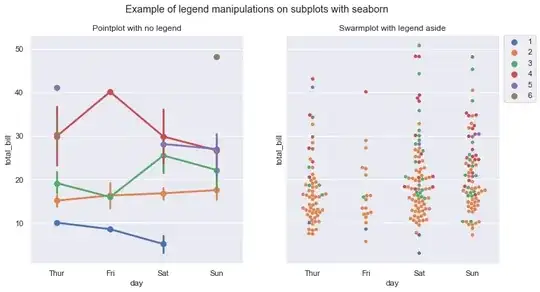
And you're gonna get this:

That's it!
If you change the procedure to importing data from an Excel file instead of a textfile (using Get Data | Excel , you've successfully combined the powers of Excel, Power BI and R to produce a scatterplot!
I hope this is what you were looking for!


