I've been trying to use the Image-Charts Api as a substitute for the now-deprecated Google Image Charts Api. I've been looking over the documentation and attempting to construct a python script to create graph representing the past 24-hours' crypto (ethereum) pricing.
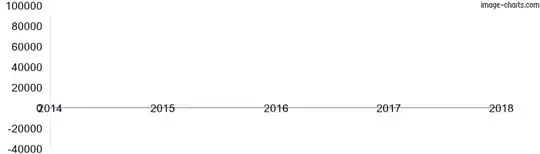
I have been able to get the data from the cryptocurrency Api just fine. The issue arises when trying to "extendedEncode" that list of prices as Image-Charts' documentation says needs to be done for large datasets & large values. I have to be doing something wrong in the encoding function since my chart always comes out distorted like so

They provide the javascript function for encoding these values & datasets, which I attempted to translate into python. I suspect that in translating the function I messed something up, but I'm not 100% sure.
The Question
Can anyone spot where I'm going wrong when encoding and/or plotting the data?
Condensed, working python code - Outputs chart url
from datetime import datetime
import requests
import time
import math

EXTENDED_MAP = 'ABCDEFGHIJKLMNOPQRSTUVWXYZabcdefghijklmnopqrstuvwxyz0123456789-.'
EXTENDED_MAP_LENGTH = len(EXTENDED_MAP)

def extendedEncode(arrVals, maxVal):
    chartData = 'e:'
    for val in arrVals:
        numericVal = int(float(val))
        scaledVal = int(math.floor(EXTENDED_MAP_LENGTH * EXTENDED_MAP_LENGTH * numericVal / maxVal))
        if scaledVal > (EXTENDED_MAP_LENGTH * EXTENDED_MAP_LENGTH - 1):
            chartData += '..'
        elif scaledVal < 0:
            chartData += '__'
        else:
            quotient = int(math.floor(scaledVal / EXTENDED_MAP_LENGTH))
            remainder = int(scaledVal - EXTENDED_MAP_LENGTH * quotient)
            chartData += EXTENDED_MAP[quotient] + EXTENDED_MAP[remainder]
    return chartData

ts = time.time()
utc_offset = int((datetime.fromtimestamp(ts) - datetime.utcfromtimestamp(ts)).total_seconds())
cryptocompare = 'https://min-api.cryptocompare.com/data/histohour?fsym=ETH&tsym=USD&limit=24'
chartbase= 'https://image-charts.com/chart?cht=lc&chs=700x500&chxt=x,y'

resp = requests.get(cryptocompare).json()['Data']
print '{0} data points'.format(len(resp))

lvals = [dp['close'] for dp in resp]
labels = 'chxl=0:|{0}'.format('|'.join([datetime.utcfromtimestamp(dp['time']+utc_offset).strftime('%I%p')
                                        for dp in resp]))
values = 'chd={0}'.format(extendedEncode(lvals, max(lvals)))
print '&'.join([chartbase, labels, values])
Runnable example of (distorted) graph
var i = document.getElementById("output");
i.src = `
https://image-charts.com/chart?
cht=lc&
chs=700x500&
chxt=x,y&
chxl=0:|02PM|03PM|04PM|05PM|06PM|07PM|08PM|09PM|10PM|11PM|12AM|01AM|02AM|03AM|04AM|05AM|06AM|07AM|08AM|09AM|10AM|11AM|12PM|01PM|02PM&
chd=e:-7.Y9494.i.Y.1...s.s.P.Y.Y.s.F-y-o-o-L-B-V-L-V94-B`;
<!DOCTYPE html>
<html>
<head>
<meta charset="utf-8">
<meta name="viewport" content="width=device-width">
<title>JS Bin</title>
</head>
<body>
<img id="output"></img>
</body>
</html>