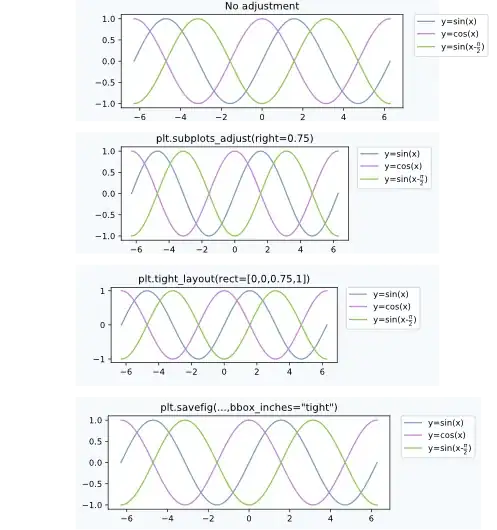
May somebody know which is the scheme of color used in this post for the example plot ? this blue magenta, green ? which kind of style it is ??

EDIT ah ok I thought that was a known schemes
May somebody know which is the scheme of color used in this post for the example plot ? this blue magenta, green ? which kind of style it is ??

EDIT ah ok I thought that was a known schemes
The shown plot comes from this answer. The colors in use are just hardcoded and do not belong to any official color scheme. The line colors are
["#7aa0c4", "#ca82e1", "#8bcd50"]
The background color is
"#f6f9fd"
The complete script to generate the plot is also available here.
In general, if you like to reproduce the colors from some image you find it's often easiest to use a color picker.
Since I invented this "scheme", you may of course ask how I would imagine it to continue for more colors. A quick guess would be the following:
["#7aa0c4", "#ca82e1", "#8bcd50", "#df9f53", "#64b9a1", "#745ea6", "#db7e76"]
Example:
import numpy as np
import matplotlib.pyplot as plt

cols = ["#7aa0c4", "#ca82e1", "#8bcd50", "#df9f53", "#64b9a1",
        "#745ea6", "#db7e76"]

plt.rcParams["axes.prop_cycle"] = plt.cycler("color", cols)

x = np.linspace(0,4*np.pi, 101)
fig, (ax, ax2) = plt.subplots(nrows=2)
for i in range(7):
    ax.plot(x, np.sin(x)-0.2*i)
    ax2.plot(x, np.sin(x-np.pi*i/7))

plt.show()