2

as always, this forum is my last hope to find a solution to my question. I'm working on a dataset where some participants (children) received an intervention program to improve their social skills/attitudes. Before the treatment, all participants saw a video clip where a "soccer game", a "basketball" and "snooker" happened and the actors were "aggressive", or "assertive" or "neutral".

All participants replied if the actor behavior was "wrong", "right" or "I don't know". After the intervention, they saw the same videos and they had to say if the action was "wrong", "right" or "I don't know".

We expect that -- after the intervention program, the participants will say "right" for the "assertive" behavior and "wrong" for the "aggressive" behavior for all situations.

I'm dealing with this question using Mcnemar test approach, but I'm having some difficulties to plot a nice graph and I really think this forum community will help me to understand what's going on.

The following code works and is a reproducible example and reply to the question for each situation -- what attitude increased/decreased after the invervention.

library(tidyverse)
set.seed(123)
ds <- data.frame(ID=seq.int(nrow(ds)),
                 situation=rep(c("Soccer","Basketball","snooker"),20),
                 attitude=c("aggressive","assertive","neutral"),
                 response_t1=c("wrong","Right","I Don't"),
                 response_t2=rep(c("wrong","Right","I Don't"), times=c(10,35,15)))

ds %>% 
  gather(key="Time",value, response_t1:response_t2) -> j

j  %>% 
  group_by(attitude, Time, situation, value) %>% 
  summarise(n = n()) %>% 
  ggplot(., aes(x = value, y = n, fill=Time)) + 
  geom_bar(stat = "identity", width=0.5, position = position_dodge(width=0.6)) +
  facet_wrap(~ situation*attitude, ncol = 3) 
Valid XHTML.

As you can see, the plot is "almost ok", however, the bar width is different across bars.

Two questions: Do you suggest another graph approach? Do you suggest another statistical approach?

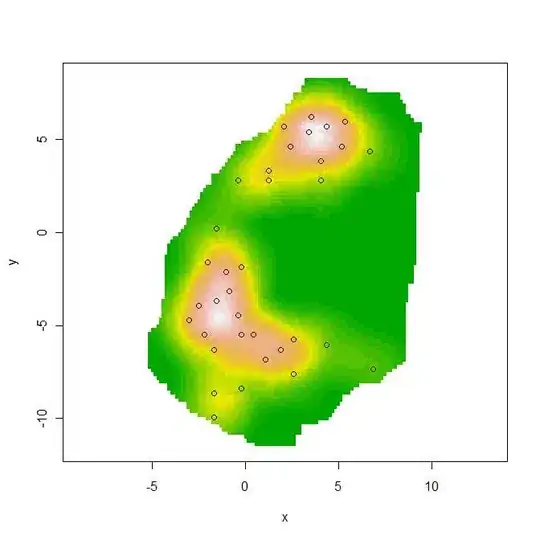
This graph here is very interesting https://i.stack.imgur.com/EIQZd.jpg
Luis
  • 1,388
  • 10
  • 30
  • Suggested duplicates: [Consistent width for geom_bar in the event of missing data](https://stackoverflow.com/q/11020437/903061) and [Control column widths in a ggplot2 graph with a series and inconsistent data](https://stackoverflow.com/q/28890227/903061) – Gregor Thomas Aug 07 '18 at 14:51
  • 2
    See `preserve = "single"` in `position_dodge()` and/or `position_dodge2()` for getting the same bar width. One main difference between the two dodging functions has to do with how the single bars are centered. – aosmith Aug 07 '18 at 14:52
  • As for your plot type, depends on what comparisons you want to draw. It's hard to tell with this fake data, this draws effective comparisons between the times and the responses within each sport, but makes it a bit hard to compare sports. Something else to try would be putting "time" on the x-axis and using a line plot, perhaps faceting by response and coloring by sport. – Gregor Thomas Aug 07 '18 at 14:55
  • @Gregor you are right. I edited my text to make it clear. Thanks much. I also checked the links you sent, but my question has more factors/variables, what makes it harder to deal with. Actually, this fake data emulates the original one. Thanks much! – Luis Aug 07 '18 at 15:00

1 Answers1

3

You can use option preserve = "single" to get the same bar width everywhere

library(tidyverse)
set.seed(123)
ds <- data.frame(
  ID = seq.int(60),
  situation = rep(c("Soccer", "Basketball", "snooker"), 20),
  attitude = c("aggressive", "assertive", "neutral"),
  response_t1 = c("wrong", "Right", "I Don't"),
  response_t2 = rep(c("wrong", "Right", "I Don't"), times = c(10, 35, 15))
)

ds %>%
  gather(key = "Time", value, response_t1:response_t2) -> j
#> Warning: attributes are not identical across measure variables;
#> they will be dropped

j %>%
  group_by(attitude, Time, situation, value) %>%
  summarise(n = n()) %>%
  ggplot(., aes(x = value, y = n, fill = Time)) +
  geom_col(width = 0.5, position = position_dodge(preserve = "single", width = 0.6)) +
  facet_wrap(~situation * attitude, ncol = 3)

Created on 2018-08-07 by the reprex package (v0.2.0.9000).

Tung
  • 26,371
  • 7
  • 91
  • 115