I recently started using R language and now i am using R for most of my 2d plots. Now, I want to use R for generating 3d plots. I have x, y, z data coming from a tool, till now i was using splot in gnuplot to generate a surface plot. I want to use R for generating a surface plot similar to the one splot in gnuplot gives. Problem i see is, to generate a 3d plot R requires data to be in matrix format but my data is not in that format. My question is, if gnuplot is able to generate a plot from the data why R cant do it. I am sure i am missing something, please help me
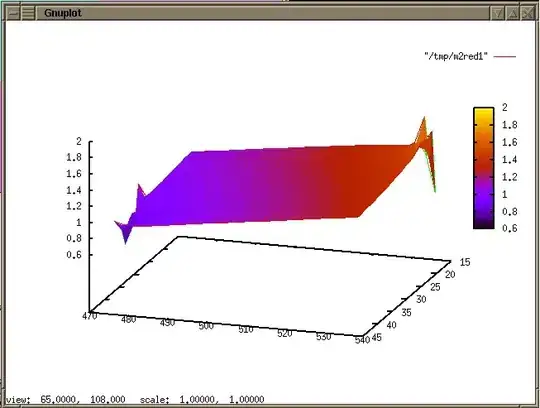
Here is the plot from gnuplot
This is the data
17.46 537.74 0.8
18.36 537.74 1.6
19.26 537.74 1.3
19.395 537.74 1.7
21.015 537.74 1.9
35.46 475.26 1.2
36.36 475.26 0.8
37.395 475.26 0.9
39.96 475.26 0.6
43.56 475.26 1