9

I want to create a 3d scatter plot of spheres with their color being the fourth dimension. I have the data in a csv file where each line indicates the x,y,z position of a particle and I have a column which tells me the value of the particle (1,2 or 3). I want to color the balls in one color if their value is 1 or in another color otherwise.

Edit:

I created the following code:

library(rgl)
m <- read.csv(file="mem0.csv", sep = ",", head=TRUE)
mcol = m$val
i = 1 
mdim = dim(m)

while (i <= mdim[1] ){
   if (mcol[i] == 1){
      mcol[i] = "red"
   }else {
      mcol[i] = "blue"
   }
   i = i +1
}

plot3d(m$x, m$y, m$z, col = mcol, type='s', size=0.1)

Edit number 2:

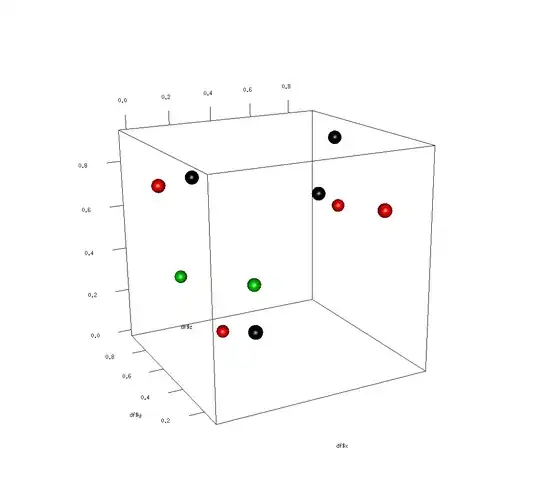
I use the rgl.snapshot() to export to an svg file:

a snapshot of my rgl.shanpshot

The data should display a layer of red balls, 4 layers of blue balls and a layer of red balls again.

amonk
  • 1,769
  • 2
  • 18
  • 27
Yotam
  • 10,295
  • 30
  • 88
  • 128
  • possible duplicate of [R: 4D plot, x, y, z, colours](http://stackoverflow.com/questions/3786189/r-4d-plot-x-y-z-colours) – Richie Cotton Mar 07 '11 at 15:50

1 Answers1

17

The plot3d() function of the rgl package allows to do such a thing quite easily. And you can even explore your plot interactively :

R> library(rgl)

R> df <- data.frame(x=runif(10,0,1),
+                  y=runif(10,0,1),
+                  z=runif(10,0,1),
+                  color=round(runif(10,1,3)))
R> df
            x         y          z color
1  0.73518229 0.1385970 0.69053482     2
2  0.88789302 0.6872121 0.54734176     2
3  0.79402546 0.5771570 0.89613292     1
4  0.19922140 0.2117405 0.25116078     1
5  0.31825325 0.7449661 0.01174593     2
6  0.64614521 0.4704698 0.68905621     1
7  0.15242295 0.6461338 0.77896858     1
8  0.32698024 0.4548752 0.33969754     3
9  0.00793849 0.6557488 0.75901935     2
10 0.20460232 0.9302882 0.23413984     3

You can call plot3d() like this :

R> plot3d(df$x, df$y, df$z, col=df$color, size=2, type='s')

Which will give you something like :

plot3d result

juba
  • 47,631
  • 14
  • 113
  • 118
  • Thanks. This kinda work with two somewhat important issues: 1, I want to color all the balls in one color (say, red) and a set of balls with special values in another color (say, blue). 2, I have created 1000 balls and the colors are wrong. Could it be that there are too much balls? – Yotam Mar 07 '11 at 19:03
  • 2
    You should create another "color" variable in your data frame, with the name of the color you want for each spheres. And if there are a great number of spheres, the same colors will be assigned several times. – juba Mar 07 '11 at 22:28