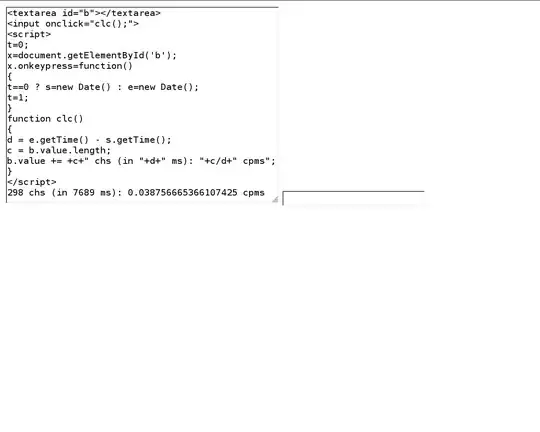
You can use plot function to plot raster file and annotations using text function. Please see the code below:
library(png)
library(shiny)
library(RCurl)

# Define UI for application that draws a histogram
ui <-fluidPage(
  titlePanel("Annotated plot output"),

  fluidRow(

           plotOutput("plot1")
  )
)

# Define server logic required to draw a histogram

server <- function(input, output, session) {
  output$plot1 <- renderPlot({
    myurl <- "https://i.stack.imgur.com/GcpUb.png"
    ima <- readPNG(getURLContent(myurl))
    op <- par(mar = rep(0, 4))
    plot(NULL, xlim = c(0, 100), ylim = c(0, 100), xaxs = "i", yaxs = "i")
    rasterImage(ima, 0, 0, 100, 100, interpolate = TRUE)
    text(50, 50, "Custom Label1", col = "red", cex = 2)
    text(25, 25, "Custom Label2", col = "red", cex = 2)
    par(op)
  })
}

# Run the application
shinyApp(ui = ui, server = server)
Output:


