3

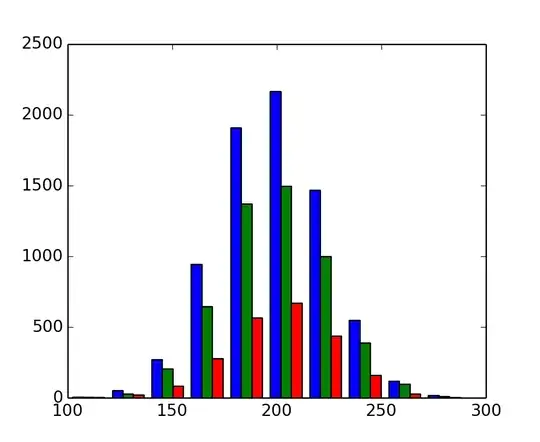
I am trying to plot bar style histograms with multiple classifications as stored in a pandas dataframe. I can get the the histograms to plot using both the methods below, however they cover each other and I'd like to plot them side by side. In the second case, the histtype variable appears to be ignored.

Is there a way to do this using one of the two methods below?

I have tried like this

import numpy as np
import pandas as pd
import matplotlib.pyplot as plt
import seaborn as sns
colour = 0
for var in array:
    l = [var]
    df_array=df.loc[df.var.isin(l) , :]
    df_array[v].dropna(inplace=True)
    plt3=sns.distplot(df_array[v],label=var,kde=False)
    colour += 1

Seaborn Type Plot

and like this

import numpy as np
import pandas as pd
import matplotlib.pyplot as plt
colour = 0
for var in array:
    df_array=df.loc[df.var.isin([var]) , :]
    df_array[v].dropna(inplace=True)
    plt4 = plt.hist(list(df_array[df_array['var'] == var][v]), 
                     histtype = 'bar', stacked = False)
    colour += 1
Matplotlib type Plot

I would like to produce a final plot similar to this Side by Side Histogram from Web

MicrobicTiger
  • 577
  • 2
  • 5
  • 21
  • It is a bit unclear what you are asking. Do you want each iteration of the for loop to produce a new subplot? See https://matplotlib.org/examples/pylab_examples/subplots_demo.html You could also look at something like this: https://seaborn.pydata.org/examples/kde_ridgeplot.html – KPLauritzen Sep 20 '18 at 10:35
  • Thanks @KPLauritzen I have added a clarifying image above. I'd like all the histgrams on the same plot with the same bins. – MicrobicTiger Sep 20 '18 at 21:18
  • Check Gustavo Bezerra's answer on this thread. It should be what you want. https://stackoverflow.com/questions/6871201/plot-two-histograms-at-the-same-time-with-matplotlib – Saedeas Sep 21 '18 at 00:40
  • Thanks @Saedeas. I had seen that post. The solution doesn;t quite work in this isnstance as it requires all the lists to be generated as independent lists and then run through the histogram together. This would mean I have to name a new list inside my loop and then run the histogram. – MicrobicTiger Sep 21 '18 at 01:20
  • I think you can just create an empty list before your loop, and append the series you want to plot to it. Then call the histogram function after your loop with the appended to list as its argument. – Saedeas Sep 21 '18 at 01:42
  • Any chance you could post the code of how to do that? – MicrobicTiger Sep 21 '18 at 02:15
  • You would get more help if you were to provide a [Minimal, Complete, and Verifiable example](https://stackoverflow.com/help/mcve), in particular an example dataset reproducing the issue – Diziet Asahi Sep 21 '18 at 13:08
  • You need to explain your dataset/post a sample to get more help. Add something showing fake data where there are only like three values in each histogram. If you do that, I can show you how to generate the plot. – Saedeas Sep 21 '18 at 18:15
  • 1
    I think the OP did it :) – quant_dev Nov 05 '18 at 17:49
  • Does that work for you? https://stackoverflow.com/questions/36362624/how-to-plot-multiple-histograms-on-same-plot-with-seaborn – quant_dev Nov 05 '18 at 17:52
  • Thanks @quant_dev I did find my answer. I'll post it when I get chance. – MicrobicTiger Nov 07 '18 at 21:14

0 Answers0