I have a scatterplot and I need to draw a contour that contains all (or almost all) points.
I have managed to do that with stat_density_2d() with the bins option set to 2 and the geom_polygon(). However, since I have to set the bin to 2, I still have 2 contours, one in the 'center' of the polygon and the outter one. I only need the outter one.
What I have (a polygon with 2 bins: an inner one and the outter one):
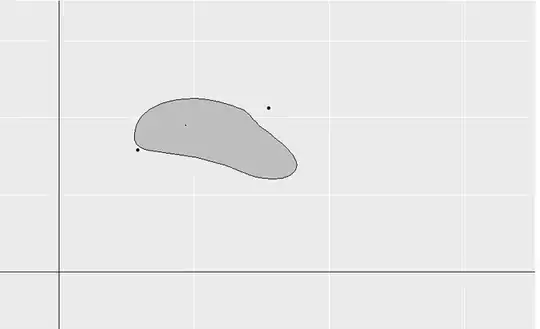
What I need:

The inner bin looks small in this example but it looks unprofessional in bigger and more complex graphs.
Example:
set.seed(20)
x = rnorm(20, 3)
y = rnorm(20, 4)
points = tibble('x'=rnorm(10, 3), 'y'=rnorm(10, 4))
ggplot2::ggplot(data=points, mapping=aes(x=x, y=y, fill='grey', colour='black')) +
  geom_point() +
  stat_density_2d(aes(colour='black'), bins=2, geom='polygon') +
  scale_fill_identity() + scale_colour_identity() +
  geom_vline(xintercept=0, colour = 'black', linetype = 'solid') +
  geom_hline(yintercept=0, colour = 'black', linetype = 'solid') +
  xlim(-8, 8) + ylim(-8, 8)
Similar questions:
(the package in which this soution is based it is not longe availble)
ggplot: How to draw contour line for 2d scatter plot to outline the data points
How to plot a contour line showing where 95% of values fall within, in R and in ggplot2