I have this data frame
df <- data.frame(x = 1:8,
                 y1 = c(1:2, NA, NA,3:4, NA, NA),
                 y2 = c(NA, NA,3:4, NA, NA, 5:6),
                 type = c("A", "A","A","A","B","B","B","B"))

#df
x y1 y2 type
1  1 NA    A
2  2 NA    A
3 NA  3    A
4 NA  4    A
5  3 NA    B
6  4 NA    B
7 NA  5    B
8 NA  6    B
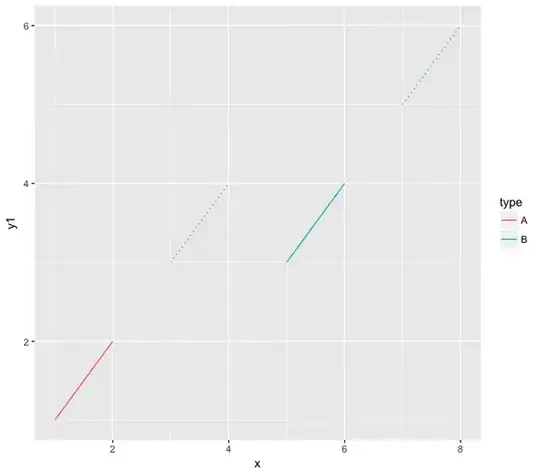
I can plot it the way I want using ggplot2:
ggplot(df, aes(x = x, y = y1, col = type))+
      geom_line()+
      geom_line(aes(y=y2), linetype=3)
And it looks like this
I would like to make the same plot using R highcharter package but I haven't been able to figure it. Thank you for your help.