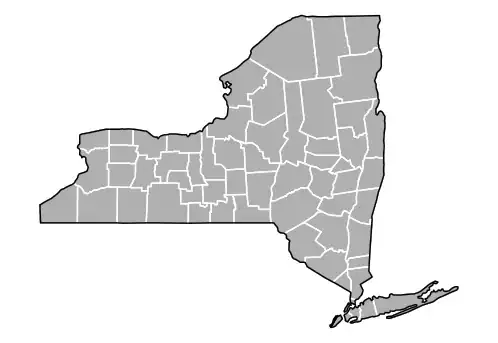
I wanted to plot points on the state of New York map that I made through
#NY state map

usa <- map_data("usa")
states <- map_data("state")
ny_df <- subset(states, region=="new york")
ny_base <- ggplot(data=ny_df, mapping=aes(x=long, y=lat, group=group))+
  coord_fixed(1.3) +
  geom_polygon(color="black", fill="gray")
ny_base+theme_nothing()

counties <-map_data("county")
ny_county <- subset(counties, region=="new york")
ny_base + theme_nothing() +
  geom_polygon(data=ny_county,fill=NA, color="white")+
  geom_polygon(color="black", fill=NA)
The above code gives me this:
However, once I'm trying to add my points through
ny_base + theme_nothing() +
   geom_polygon(data=ny_county,fill=NA, color="white") +
   geom_polygon(color="black", fill=NA) +
   geom_point(data=go, aes(x=Longitude, y=Latitude), color="red", pch=1, size=1, inherit.aes=FALSE)
The above code gives me this:
I lose my NY state map and I only get to keep my points. What seems to be the problem?

