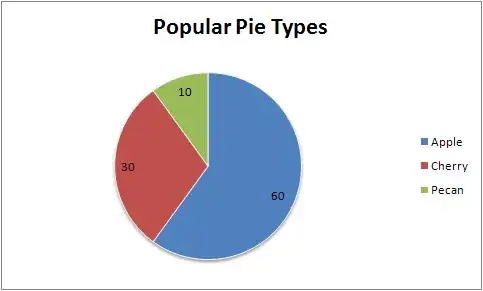
I have data like this:
Day Hour Minute   averagespeed
1    0    14       55
1    0    29       65
1    0    44       70
1    0    59       55
1    1    14       32
1    1    29       50
1    1    44       96
1    1    59       54
1    2    14       64
1    2    29       70
I want to plot this data as bar chart or histogram but the x axis is in hours from 0 to 23 and divided into 4 intervals of 15 minute intervals like this :
0 14 29 44 59 1 14 29 44 59 2 14 29 44 59 ..............23
against averagespeed for the y axis.
this data is for 30 days and I do not know how to make the x axis like that based on my columns shown above.
