I am seeing debug statements in the console but the debugger does not stop on any breakpoints. I tried clearing all breakpoints and adding them back in. Not sure how this can happen but it is.
Asked
Active
Viewed 5.7k times
63
-
My solution was reinstalling Eclipse. Possible weaker solutions are: workspace cleaning (remove all eclipse file and import from the resulting project; Clean Project, Restart Eclipse. – Gangnus Dec 10 '19 at 21:12
14 Answers
74
Solution that worked for me:
- Simply uninstall the app from the device (manually on the device) and try debugging again(!)
-
-
-
1That's rigth! On new phone I've tried Run and then Debug. After that breakpoints stopped work. After uninstall app from phone and rerun Debug mode, breakpoints started work again – maniek099 Apr 13 '20 at 10:26
-
I finally found the ultimate solution for my worst nightmare using Android Studio! – Thanh-Nhon Nguyen Jun 09 '20 at 13:01
-
1I've been using Android Studio for years and have never had to do this. No idea what changed, but I just tried uninstalling it and it worked! Thanks! – Cowabunghole Aug 07 '20 at 15:22
-
Try the solution from @Kaz - "Attach debugger to Android process", it may save you this trouble. – VectorVictor May 30 '21 at 21:24
-
54
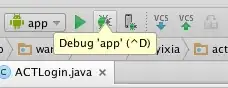
If you use Android studio, click debug app instead of run app:
Allen
- 6,745
- 5
- 41
- 59
-
2Silly me! +1. This should be the accepted answer. Android studio warns you against putting `android:debuggable="true"` in the application manifest which is suggested in the accepted answer. – RBT Feb 26 '17 at 11:57
27
According to this answer, Inside build.gradle for your app module, disable minifyEnable for your build variant and change it to false. Then, it should be:
minifyEnabled false
othewise you will see Line number not available in class xxxx when you hover over breakpoint markers and they will be looked with a cross on them
VSB
- 9,825
- 16
- 72
- 145
-
I will add that I did not see the mentioned message when hovering the breakpoint. Non-working breakpoint were missing a little checkmark on it essentially leaving them as a plain red circle whereas the working breakpoints had this checkmark. – Max Hille Aug 07 '20 at 08:17
19
Have you set the debuggable flag in the AndroidManifest? If you miss that, do so by adding android:debuggable="true" in the application tag. It should look like that in the end:
<application android:icon="@drawable/icon" android:label="@string/app_name" android:debuggable="true">
-
9
-
3
-
@Wooff as if I don't have enough files littering my dev folder. Are you saying I need another "debug" folder. I think Linux would be a more maintainable solution. – John Jun 10 '18 at 10:58
-
2
-
@ZdravkoDonev `debuggable` flag is now defined in build.gradle (see https://developer.android.com/studio/build/build-variants#build-types) – Vadim Kotov Apr 24 '19 at 12:57
-
-
1@BhunnuBaba Yes, reinstalling Eclipse. Weaker solutions are: workspace cleaning (remove all eclipse file and import from the resulting project; Clean Project, Restart Eclipse. – Gangnus Dec 10 '19 at 21:12
-
I tried the solution but the android studio won't let me and shows me the message ```Avoid hardcoding the debug mode``` – iatharva Sep 01 '21 at 09:39
15
In my case, click the "Attach debugger to Android process"

And it will shows a window said "Choose Process" Select the device you are using, and select the project that you want to debug. And it works.
Sometimes the debugger need to re-attach to the devices when you open the debugger at the first time.
John Bentley
- 1,676
- 1
- 16
- 18
Kaz
- 165
- 1
- 8
9
For Android Studio:
- Check if the option
Mute Breakpointsis enabled by mistake. The icon looks like this:
For Eclipse:
- Check if the option "Skip All Breakpoints" is enabled by mistake. It is the last icon on the following toolbar


-
1
-
In Android Studio, "Mute Breakpoints" option is present inside Debug view. Check my edited answer. – Kushal Nov 15 '18 at 10:31
5
Did you do "Debug As --> Android Application" instead of "Run As"?
Only if you do "Debug As", eclipse will stop at breakpoints.
tmin
- 1,313
- 13
- 15
3
I had the same problem. Go to build.gradle. You must change this code if you have one.
buildTypes {
    release {
        minifyEnabled true
        shrinkResources true
        proguardFiles getDefaultProguardFile('proguard-android-optimize.txt'), 'proguard-rules.pro'
    }
    debug {
        debuggable true
        minifyEnabled true
        shrinkResources true
        proguardFiles getDefaultProguardFile('proguard-android-optimize.txt'), 'proguard-rules.pro'
    }
}
The debug section should look like this:
buildTypes {
    release {
        minifyEnabled false
        shrinkResources false
        proguardFiles getDefaultProguardFile('proguard-android-optimize.txt'), 'proguard-rules.pro'
    }
    debug {
        debuggable true
        minifyEnabled false
        shrinkResources false
        proguardFiles getDefaultProguardFile('proguard-android-optimize.txt'), 'proguard-rules.pro'
    }
}
I hope your problem is solved
Karol Wasowski
- 465
- 1
- 6
- 18
javad mohammadi
- 31
- 4
1
if you have added some build type in build.gradle check to have debuggable true
buildTypes {
    debug {
        debuggable true
        minifyEnabled false
        proguardFiles getDefaultProguardFile('proguard-android-optimize.txt'), 'proguard-rules.pro'
    }

    release {
        minifyEnabled true
        proguardFiles getDefaultProguardFile('proguard-android-optimize.txt'), 'proguard-rules.pro'
    }
}
Mojtaba Haddadi
- 1,346
- 16
- 26
0
In my case, the app created a service with a different process with android:process=":service" in the AndroidManifest. So I was setting breakpoints in the service process code while the debugger is automatically attached to the main app process. Pretty stupid of me but it might help someone else.
You attach to the service process with Run > Attach Debugger To Android Process and choose the service process. You might need to add android.os.Debug.waitForDebugger(); to your service process code if you can't attach in time manually.
As far as I know, there's no way to automatically tell Android Studio or IntelliJ to attach to a different process before running.
georgiecasey
- 21,793
- 11
- 65
- 74
0
i had this problem i clean buildTypes part of build.gradle and try age so it work me.
somia molaei
- 111
- 1
0
None of the valid answers above worked for me. In my case there was another app still in the background that I had launched some time earlier via Android Studio. So not the same App/PackageId, but another. After closing that app I got hits on breakpoints via wifi debugging.
Mike de Klerk
- 11,906
- 8
- 54
- 76
-1
I had the same issue and resolved it by increasing the debugger timeout values. The emulator is slow as a dog on my Dev box and that is what prevented the debugger to catch and stop on breakpoints. I changed the timeout values respectively from 3000 to 10000 and 20000 to 60000 and all is fine now.
V.
-
1Where do you set the debugger timeout values? I think I have the same problem as you, because the debugger catches on every breakpoint when I debug on a physical device, but most often fails to catch on the first breakpoint I set when I debug on the emulator. -Sarah – Lazy Babe Sep 03 '14 at 17:08