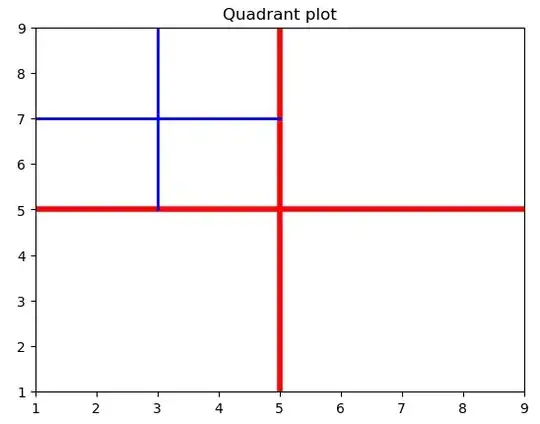
My objective is to draw a graph with 4 quadrants and plot points in the same. And also, how can I divide a quadrant into several sectors? How can I do the same in matplotlib: a graph/plot with 4 quadrants. With x axis (1-9) and y-axis(1-9)?
-
3Answers here are not too useful. Check [this one](https://stackoverflow.com/a/52750804/4124317) and the [link to the documentation](https://matplotlib.org/gallery/ticks_and_spines/spine_placement_demo.html) instead. – ImportanceOfBeingErnest Sep 08 '19 at 13:57
3 Answers
From the question, it sounds like you want a single graph with several delineated regions with a specific xy range. This is pretty straightforward to do. You can always just draw lines on the plot to delineate the regions of interest. Here is a quick example based on your stated objectives:
import matplotlib.pyplot as plt

plt.figure()
# Set x-axis range
plt.xlim((1,9))
# Set y-axis range
plt.ylim((1,9))
# Draw lines to split quadrants
plt.plot([5,5],[1,9], linewidth=4, color='red' )
plt.plot([1,9],[5,5], linewidth=4, color='red' )
plt.title('Quadrant plot')
# Draw some sub-regions in upper left quadrant
plt.plot([3,3],[5,9], linewidth=2, color='blue')
plt.plot([1,5],[7,7], linewidth=2, color='blue')
plt.show()
- 856
- 6
- 9
-
Unfortunatelly this is not valid anymore on newer versions of matplotlib – Gabriel Caldas Nov 09 '22 at 16:39
-
Yeah I think the hold('on') is now deprecated, but everything else still works. Answer updated accordingly. – T3am5hark Nov 10 '22 at 21:40
I would take a look at the AxesGrid toolkit:
http://matplotlib.sourceforge.net/mpl_toolkits/axes_grid/index.html
Perhaps the middle image at the top of this page is something along the lines of what you are looking for. There are examples on the following page in the API documentation that should be a good starting point:
http://matplotlib.sourceforge.net/mpl_toolkits/axes_grid/users/overview.html
Without an example of what you want to do exactly it is difficult to give you the best advice.
- 66,734
- 27
- 141
- 140
you need subplot see this example:
http://matplotlib.sourceforge.net/examples/pylab_examples/subplot_toolbar.html
- 8,378
- 9
- 42
- 70
