3

I have two nested lists with the values for the x-axis and y-axis that I want to plot in the same figure.

Whith a for loop to iterate through the values produces the expected plot, but for large lists is relatively slow. So I was looking for the same functionality but without the loop, which I thought matplotlib could handle, but the plot is not what I was expecting.

Here's the code:

import matplotlib.pyplot as plt
xs = [[11, 20], [31, 31], [32, 33]]
ys = [[1, 10], [3, 4], [6, 10]]

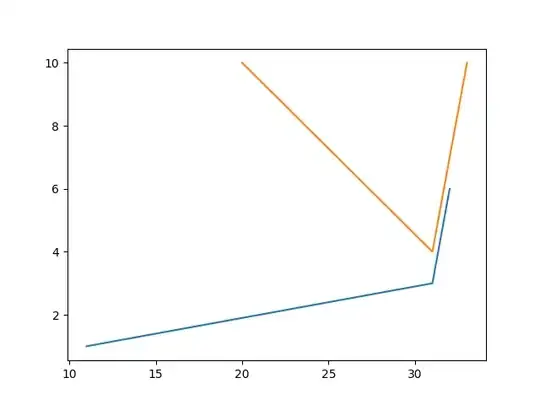
With a loop the figure is OK:

fig, ax = plt.subplots()
for i, x in enumerate(xs):
    ax.plot(x, ys[i])
plt.show()

enter image description here

But just giving the lists to matplotlib, doesn't generate the same plot:

fig, ax = plt.subplots()
ax.plot(xs, ys)
plt.show()

enter code here

What would be the proper way for doing this whithout a loop?

PedroA
  • 1,803
  • 4
  • 27
  • 50

1 Answers1

4

When the list of line segments is large, you can improve performance by using a LineCollection instead of multiple calls to plt.plot:

import numpy as np
import matplotlib.pyplot as plt
import matplotlib.collections as mcoll

xs = [[11, 20], [31, 31], [32, 33]]
ys = [[1, 10], [3, 4], [6, 10]]
fig, ax = plt.subplots()

# https://matplotlib.org/gallery/color/color_cycle_default.html
prop_cycle = plt.rcParams['axes.prop_cycle']
colors = prop_cycle.by_key()['color']
segments = np.array(list(zip(xs, ys))).swapaxes(1,2)
line_segments = mcoll.LineCollection(segments, colors=colors)
ax.add_collection(line_segments)
ax.set(xlim=(10,34), ylim=(0,11))
plt.show()

enter image description here

Here are some additional examples that use LineCollection:


LineCollection expects the first argument to be a sequence of the form [(pt0, pt1), (pt2, pt3), (pt4, pt5), ...], where each pt is of the form (x-coord, y-coord). Matplotlib will then render this LineCollection as line segments

pt0 --> pt1 
pt2 --> pt3
pt4 --> pt5
etc.

The reason why swapaxes was used in the code above is because zip(xs, ys) creates pairs of the form ((x0, x1), (y0, y1)), whereas LineCollection wants pairs of points to be of the form ((x0, y0), (x1, y1)).

unutbu
  • 842,883
  • 184
  • 1,785
  • 1,677
  • Sounds good. Haven't heard about `LineCollection` before, but it's definitely more efficient. One thing I noticed is that you have to explicitly set xlim/ylim, otherwise the figure is just shown around 0:1. Is this true? – PedroA Oct 28 '18 at 21:15
  • 1
    Yes, that's true. Unlike the higher-level plotting functions, (e.g. `plt.plot`, `plt.scatter`, `plt.imshow`, etc), the `mcoll.LineCollection` is a lower-level artist. It is added directly to the axes, `ax`, but does not alter the axes' xlim and ylim. So you have to set them yourself. – unutbu Oct 28 '18 at 21:38