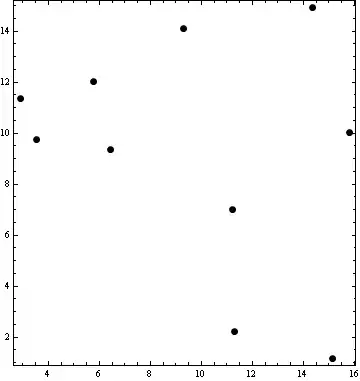
I am trying to make a layout plot that merges 3 plots. I want the first plot in the first row and the other ones in the second row like this image:
The problem comes when I try to combine plots integrated in R and a plot made with ggplot2 library. My code is the following:
layout(matrix(c(1, 1,
                2, 3), nrow=2, byrow=TRUE))
layout.show(n=3)
qplot(area_mean,
      geom="histogram",
      binwidth = 5,
      main = "ggplot area min histogram",
      xlab = "Age",
      fill=I("blue"),
      col=I("red"),
      alpha=I(.2),
      xlim=c(0,3000))
hist(area_mean, col="purple", main="Histogram of area mean")
boxplot(area_mean, col="cyan", main="Boxplot of area mean")
Then my output image is:
Why qplot doesn't appear? I am missing something?
Thank you!!

