1

I'm using the plot() function in rstudio for deploying a xy plot... but what's displayed looks like an odd, unsorted boxplot.

Here is the code I use:

file = "/Users/Mike/OneDrive - Quantium/Training/Stanford/Chapter 2/Auto.csv"
Auto=read.csv(file)
plot(Auto$horsepower
     , Auto$mpg
     , xlab="Horsepower"
     , ylab="MPG"
     , type="p")

And here is what I get:
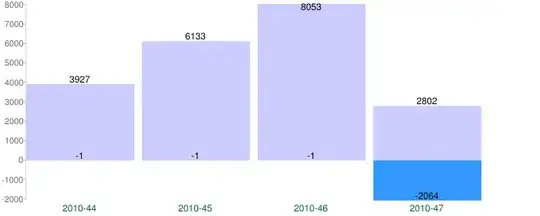
plot returned in rstudio. Note that the x axis doesn't even look sorted and, overall, it looks more like a box plot than a xy plot.

Note : if I change the order x and y, then the chart is OK.

Does anyone knows why plot() does this and how to get a proper xy plot?
thelatemail
  • 91,185
  • 12
  • 128
  • 188
  • 2
    Welcome to Stack Overflow! Could you make your problem reproducible by sharing a sample of your data so others can help (please do not use `str()`, `head()` or screenshot)? You can use the [`reprex`](https://reprex.tidyverse.org/articles/articles/magic-reprex.html) and [`datapasta`](https://cran.r-project.org/web/packages/datapasta/vignettes/how-to-datapasta.html) packages to assist you with that. See also [Help me Help you](https://speakerdeck.com/jennybc/reprex-help-me-help-you?slide=5) & [How to make a great R reproducible example?](https://stackoverflow.com/q/5963269) – Tung Nov 09 '18 at 05:06
  • 1
    Your X axis is not in order, which implies to me that `Auto$horsepower` is either character or factor instead of integer. If that is correct, change it to integer or numeric. – iod Nov 09 '18 at 05:10
  • Auto$horsepower was factor and not numeric. Thanks! – Michaël Ménaché Nov 09 '18 at 05:39

2 Answers2

3

plot defaults to boxplot if the x axis is factor and the y is numeric, and it defaults to xy plot if vice versa. For example:

df<-data.frame(a=letters[c(1:5,1:5)],b=c(1:5,11:15))
plot(df$a,df$b)

enter image description here

plot(df$b,df$a)

enter image description here

Looking at your x axis, which is not in order, I'm guessing that's your issue. This should fix it:

Auto$horsepower<-as.integer(Auto$horsepower)
iod
  • 7,412
  • 2
  • 17
  • 36
0

While the original question was answered, I was just looking for this issue without the need to reconvert x into numeric, because I wanted numeric values in the factor order (not increasing) on the x axis.

For this case, it suffices to call plot.default() instead of plot(). This uses the normal scatterplot method without switching to a boxplot.

zerweck
  • 657
  • 7
  • 14