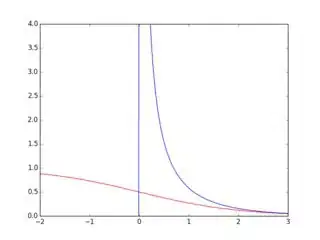
This is the code I have so far, I'm trying to set the y limit to be [0,4] and the x limit to be [-2,3]. I can take care of the plot titles myself but I can't figure out how to get these two functions on the same graph.
import math as m

from matplotlib import pylab as plt

import numpy as np

def fermi_dirac(x):

    fermi_result = (1/(np.exp(x)+1))

    return fermi_result

def bose_einstein(x):

    bose_result = (1/(np.exp(x)-1))

    return bose_result

