There are two similar questions about this:
but neither of these address this issue. I need to produce a scatter plot with individual alphas (as in question 1.) but I need to combine this with a given colormap (as in question 2.)
This is what I came up with:
import numpy as np
import matplotlib.pylab as plt
from matplotlib.colors import ListedColormap

x = np.arange(10)
y = np.arange(10)
# These are the colors for my data
z = np.arange(10)
# These are the alpha values for my data
alphas = np.linspace(0.1, 1, 10)

# Color map I want to use
cm = plt.cm.get_cmap('viridis')
# Get the colormap colors for my data
my_cmap = cm(z)
# Set alpha
my_cmap[:, -1] = alphas
# Create new colormap
my_cmap = ListedColormap(my_cmap)

plt.subplot(121)
plt.scatter(x, y, cmap=cm, c=z)
plt.subplot(122)
plt.scatter(x, y, cmap=my_cmap, c=z)
plt.show()
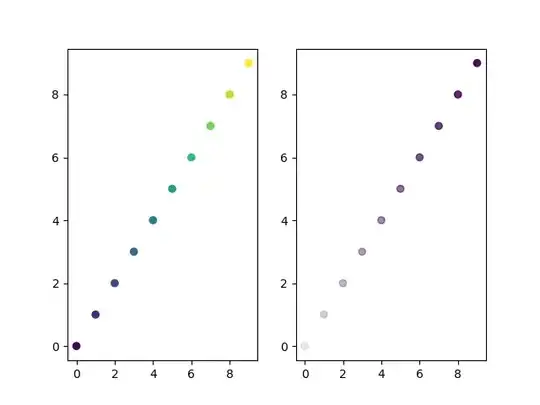
but the result is not what I expect:
where the image to the left is what the scatter plot looks like using the colormap and no alphas, and the plot to the right is my attempt to add individual alphas to the data points.
