3

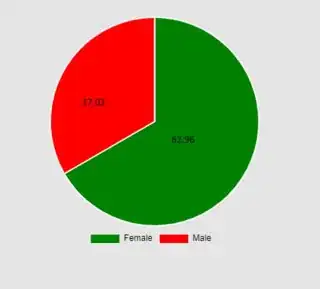
As in fig I can implement pie chart but how to show data on chart

enter image description here

like this:

enter image description here

<canvas baseChart  class="pie"
  [data]="Data"
  [labels]="Labels"
  [colors]="Colors"
  [chartType]="pieChartType">
</canvas>

 public Labels:string[]=['Female','Male'];
 public Data:any =[51,30];
 public pieChartType:string = 'pie';
 public Colors:any = 
 [
{
  backgroundColor: [      
  'green',
  'red'
  ]
  }
]; 
Taazar
  • 1,545
  • 18
  • 27

1 Answers1

-1

First you need to run two npm command

npm install ng2-charts --save

npm install chart.js --save

Important: Embedding Chart.js in application is mandatory! in your index.html

<script src="node_modules/chart.js/src/chart.js"></script>

Import this one on App.module.ts

import { ChartsModule } from 'ng2-charts';
imports: [ChartsModule]

Component.html

<div style="display: block">
  <canvas baseChart
          [data]="pieChartData"
          [labels]="pieChartLabels"
          [chartType]="pieChartType"
          (chartHover)="chartHovered($event)"
          (chartClick)="chartClicked($event)"></canvas>

Component.ts

public pieChartLabels: string[] = ['Male', 'Female'];
  public pieChartData: number[] = [51, 30];
  public pieChartType: any = 'pie';

  // events
  public chartClicked(e: any): void {
    console.log(e);
  }

  public chartHovered(e: any): void {
    console.log(e);
  }

this code is working as you expect.
Abhishek
  • 1,742
  • 2
  • 14
  • 25
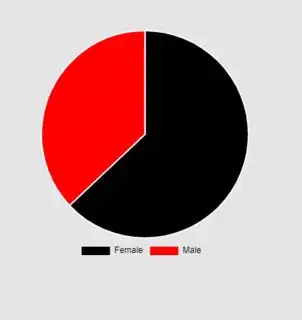
  • My code is working . It's drawing chart but I don't know what are the options there for display data on chart. which I put in fig 2 –  Dec 10 '18 at 03:58
  • `public Data:any =[51,30];` this is display on your screen if you are increase value of array i.e. 'public Data:any =[51,30,19];' that data is show three parts of pie charts. if learn more of Angular2-charts go through [link](https://valor-software.com/ng2-charts/) – Abhishek Dec 10 '18 at 04:46
  • I applied changes but it's not displaying number on chart –  Dec 10 '18 at 04:59
  • @Shaktishah can you share your code with [link] (https://stackblitz.com/) – Abhishek Dec 10 '18 at 05:10
  • 1
    https://stackblitz.com/edit/angular-ym9dzm?file=src%2Fapp%2Fapp.component.html Code is here –  Dec 10 '18 at 05:43
  • here it is showing data when we move cursor on chart but in my code it not showing and here I wrote same code so what is the problem here –  Dec 10 '18 at 05:50
  • Is there any other option for display data on chart ?? –  Dec 10 '18 at 05:55
  • @HetalAhir Sorry for late i'm busy in some other work. there is two way to handle this first one is include Tooltip library link (https://github.com/valor-software/ng2-charts/issues/802), and second one is custom link (https://stackoverflow.com/questions/22524295/how-to-add-label-in-chart-js-for-pie-chart/24755401), – Abhishek Dec 10 '18 at 07:20
  • it's in javascript not in typescript –  Dec 10 '18 at 09:16
  • And it's for lable and I want both label and number on it's respective part on pie chart –  Dec 10 '18 at 09:36
  • https://stackblitz.com/edit/doughnut-chart-6iuguq?file=app%2Fapp.component.ts reference to this it is showing data but I am receiving data from another component so I have to write public pieChartData: number[] = [51, 30]; this line In Docheck() method otherwise it gives zero value so when I write public pieChartData: number[] = [51, 30]; this line in do check method data is not showing on chart so please can anyone help me –  Dec 10 '18 at 10:20