If you just want a raw buffer, try fig.canvas.print_rgb, fig.canvas.print_raw, etc (the difference between the two is that raw is rgba, whereas rgb is rgb. There's also print_png, print_ps, etc)
This will use fig.dpi instead of the default dpi value for savefig (100 dpi). Still, even comparing fig.canvas.print_raw(f) and fig.savefig(f, format='raw', dpi=fig.dpi) the print_canvas version is marginally faster insignificantly faster, since it doesn't bother resetting the color of the axis patch, etc, that savefig does by default.
Regardless, though, most of the time spent saving a figure in a raw format is just drawing the figure, which there's no way to get around.
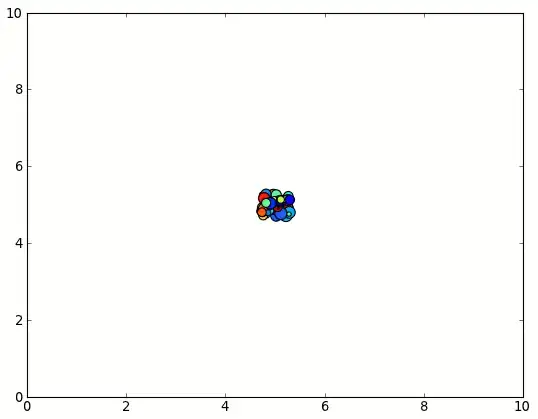
At any rate, as a pointless-but-fun example, consider the following:
import matplotlib.pyplot as plt
import numpy as np
import cStringIO

plt.ion()
fig = plt.figure()
ax = fig.add_subplot(111)
num = 50
max_dim = 10
x = max_dim / 2 * np.ones(num)
s, c = 100 * np.random.random(num), np.random.random(num)
scat = ax.scatter(x,x,s,c)
ax.axis([0,max_dim,0,max_dim])
ax.set_autoscale_on(False)

for i in xrange(1000):
    xy = np.random.random(2*num).reshape(num,2) - 0.5
    offsets = scat.get_offsets() + 0.3 * xy
    offsets.clip(0, max_dim, offsets)
    scat.set_offsets(offsets)
    scat._sizes += 30 * (np.random.random(num) - 0.5)
    scat._sizes.clip(1, 300, scat._sizes)
    fig.canvas.draw()

If we look at the raw draw time:
import matplotlib.pyplot as plt
import numpy as np
import cStringIO

fig = plt.figure()
ax = fig.add_subplot(111)
num = 50
max_dim = 10
x = max_dim / 2 * np.ones(num)
s, c = 100 * np.random.random(num), np.random.random(num)
scat = ax.scatter(x,x,s,c)
ax.axis([0,max_dim,0,max_dim])
ax.set_autoscale_on(False)

for i in xrange(1000):
    xy = np.random.random(2*num).reshape(num,2) - 0.5
    offsets = scat.get_offsets() + 0.3 * xy
    offsets.clip(0, max_dim, offsets)
    scat.set_offsets(offsets)
    scat._sizes += 30 * (np.random.random(num) - 0.5)
    scat._sizes.clip(1, 300, scat._sizes)
    fig.canvas.draw()
This takes ~25 seconds on my machine.
If we instead dump a raw RGBA buffer to a cStringIO buffer, it's actually marginally faster at ~22 seconds (This is only true because I'm using an interactive backend! Otherwise it would be equivalent.):
import matplotlib.pyplot as plt
import numpy as np
import cStringIO

fig = plt.figure()
ax = fig.add_subplot(111)
num = 50
max_dim = 10
x = max_dim / 2 * np.ones(num)
s, c = 100 * np.random.random(num), np.random.random(num)
scat = ax.scatter(x,x,s,c)
ax.axis([0,max_dim,0,max_dim])
ax.set_autoscale_on(False)

for i in xrange(1000):
    xy = np.random.random(2*num).reshape(num,2) - 0.5
    offsets = scat.get_offsets() + 0.3 * xy
    offsets.clip(0, max_dim, offsets)
    scat.set_offsets(offsets)
    scat._sizes += 30 * (np.random.random(num) - 0.5)
    scat._sizes.clip(1, 300, scat._sizes)
    ram = cStringIO.StringIO()
    fig.canvas.print_raw(ram)
    ram.close()
If we compare this to using savefig, with a comparably set dpi:
import matplotlib.pyplot as plt
import numpy as np
import cStringIO

fig = plt.figure()
ax = fig.add_subplot(111)
num = 50
max_dim = 10
x = max_dim / 2 * np.ones(num)
s, c = 100 * np.random.random(num), np.random.random(num)
scat = ax.scatter(x,x,s,c)
ax.axis([0,max_dim,0,max_dim])
ax.set_autoscale_on(False)

for i in xrange(1000):
    xy = np.random.random(2*num).reshape(num,2) - 0.5
    offsets = scat.get_offsets() + 0.3 * xy
    offsets.clip(0, max_dim, offsets)
    scat.set_offsets(offsets)
    scat._sizes += 30 * (np.random.random(num) - 0.5)
    scat._sizes.clip(1, 300, scat._sizes)
    ram = cStringIO.StringIO()
    fig.savefig(ram, format='raw', dpi=fig.dpi)
    ram.close()
This takes ~23.5 seconds. Basically, savefig just sets some default parameters and calls print_raw, in this case, so there's very little difference.
Now, if we compare a raw image format with a compressed image format (png), we see a much more significant difference:
import matplotlib.pyplot as plt
import numpy as np
import cStringIO

fig = plt.figure()
ax = fig.add_subplot(111)
num = 50
max_dim = 10
x = max_dim / 2 * np.ones(num)
s, c = 100 * np.random.random(num), np.random.random(num)
scat = ax.scatter(x,x,s,c)
ax.axis([0,max_dim,0,max_dim])
ax.set_autoscale_on(False)

for i in xrange(1000):
    xy = np.random.random(2*num).reshape(num,2) - 0.5
    offsets = scat.get_offsets() + 0.3 * xy
    offsets.clip(0, max_dim, offsets)
    scat.set_offsets(offsets)
    scat._sizes += 30 * (np.random.random(num) - 0.5)
    scat._sizes.clip(1, 300, scat._sizes)
    ram = cStringIO.StringIO()
    fig.canvas.print_png(ram)
    ram.close()
This takes ~52 seconds! Obviously, there's a lot of overhead in compressing an image.
At any rate, this is probably a needlessly complex example... I think I just wanted to avoid actual work...
