12

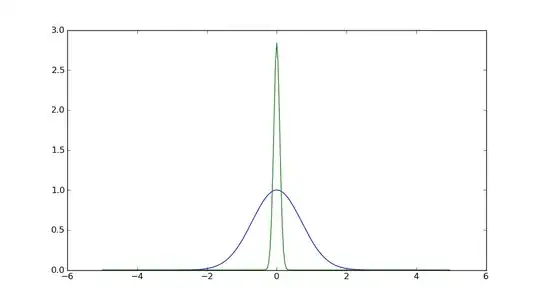
I am trying to utilize Numpy's fft function, however when I give the function a simple gausian function the fft of that gausian function is not a gausian, its close but its halved so that each half is at either end of the x axis.

The Gaussian function I'm calculating is y = exp(-x^2)

Here is my code:

from cmath import *
from numpy import multiply
from numpy.fft import fft
from pylab import plot, show

""" Basically the standard range() function but with float support """
def frange (min_value, max_value, step):
    value = float(min_value)
    array = []
    while value < float(max_value):
        array.append(value)
        value += float(step)
    return array


N = 256.0 # number of steps
y = []
x = frange(-5, 5, 10/N)

# fill array y with values of the Gaussian function   
cache = -multiply(x, x)
for i in cache: y.append(exp(i))

Y = fft(y)

# plot the fft of the gausian function
plot(x, abs(Y))
show()

The result is not quite right, cause the FFT of a Gaussian function should be a Gaussian function itself...

chutsu
  • 13,612
  • 19
  • 65
  • 86

5 Answers5

17

np.fft.fft returns a result in so-called "standard order": (from the docs)

If A = fft(a, n), then A[0] contains the zero-frequency term (the mean of the signal), which is always purely real for real inputs. Then A[1:n/2] contains the positive-frequency terms, and A[n/2+1:] contains the negative-frequency terms, in order of decreasingly negative frequency.

The function np.fft.fftshift rearranges the result into the order most humans expect (and which is good for plotting):

The routine np.fft.fftshift(A) shifts transforms and their frequencies to put the zero-frequency components in the middle...

So using np.fft.fftshift:

import matplotlib.pyplot as plt
import numpy as np

N = 128
x = np.arange(-5, 5, 10./(2 * N))
y = np.exp(-x * x)
y_fft = np.fft.fftshift(np.abs(np.fft.fft(y))) / np.sqrt(len(y))
plt.plot(x,y)
plt.plot(x,y_fft)
plt.show()

enter image description here

unutbu
  • 842,883
  • 184
  • 1,785
  • 1,677
  • Thank you; I was looking for `fftshift`, but I couldn't find it. – Steve Tjoa Mar 23 '11 at 01:48
  • Why is sqrt(2N) there? – rainman Jan 22 '19 at 00:05
  • @omehoque: There are [many different conventions](https://dsp.stackexchange.com/a/31990/4363) for defining the DFT. They are all the same up to constants. Different groups (e.g. engineers, physics, mathematicians) tend to favor different conventions. The one used above is favored by mathematicians because it makes the DFT and inverse DFT formulas symmetric. It make Parseval's Theorem particularly beautiful: `(y**2).sum()` equals `(y_fft**2).sum()`. It's also a good choice for graphing, since it makes `y` and `y_fft` roughly the same size. – unutbu Jan 22 '19 at 00:45
  • NumPy defines the DFT [this way](https://docs.scipy.org/doc/numpy/reference/routines.fft.html#implementation-details). Dividing that formula by `1/sqrt(N)` is what [this answer](https://dsp.stackexchange.com/a/31990/4363) calls the unitary scaling convention. The reason why `1/sqrt(2*N)` is used above is because `len(y)` is `2*N`, not `N`. – unutbu Jan 22 '19 at 00:50
  • I found a related question regarding the magnitude: https://scicomp.stackexchange.com/q/11233/32010. There is an answer pointing out the sampling frequency (in this case it's 10./2/128). But I don't understand where it comes. – Jason Jun 12 '19 at 01:24
  • update myself (I wish they allow editing comments beyond 5 min): the 2nd link in unutbu's comment talks about the sampling frequency. – Jason Jun 12 '19 at 02:26
4

Your result is not even close to a Gaussian, not even one split into two halves.

To get the result you expect, you will have to position your own Gaussian with the center at index 0, and the result will also be positioned that way. Try the following code:

from pylab import *
N = 128
x = r_[arange(0, 5, 5./N), arange(-5, 0, 5./N)]
y = exp(-x*x)
y_fft = fft(y) / sqrt(2 * N)
plot(r_[y[N:], y[:N]])
plot(r_[y_fft[N:], y_fft[:N]])
show()

The plot commands split the arrays in two halfs and swap them to get a nicer picture.

Plot

Sven Marnach
  • 574,206
  • 118
  • 941
  • 841
  • Do I have to split the arrays into two halves and ... for every signal I'm trying to FFT? or does this only apply to the Gaussian function, if so why? – chutsu Mar 22 '11 at 22:14
  • @chutsu: I don't know what you are trying to do. As long as you don't care how the plot of the FFT of your Gaussian looks like, it probably does not matter where to put your origin. – Sven Marnach Mar 22 '11 at 22:22
3

Following on from Sven Marnach's answer, a simpler version would be this:

from pylab import *
N = 128

x = ifftshift(arange(-5,5,5./N))

y = exp(-x*x)
y_fft = fft(y) / sqrt(2 * N)

plot(fftshift(y))
plot(fftshift(y_fft))

show()

This yields a plot identical to the above one.

The key (and this seems strange to me) is that NumPy's assumed data ordering --- in both frequency and time domains --- is to have the "zero" value first. This is not what I'd expect from other implementations of FFT, such as the FFTW3 libraries in C.

This was slightly fudged in the answers from unutbu and Steve Tjoa above, because they're taking the absolute value of the FFT before plotting it, thus wiping away the phase issues resulting from not using the "standard order" in time.

Bernard
  • 163
  • 1
  • 1
  • 6
  • I know this post is 8 years old, but this answer is the only acceptable one I have found. Every other one sweeps the phase shift issue under the rug by taking an absolute value, often even in accepted answers (such as in this post). See also here: https://stackoverflow.com/questions/56154992/fourier-transform-of-a-gaussian-function-in-python, https://scicomp.stackexchange.com/questions/11233/amplitude-of-discrete-fourier-transform-of-gaussian-is-incorrect, and many more that don't fit in a comment. Thank you for not skirting the issue. Taking the absolute value is just plain WRONG. – snar Nov 03 '21 at 00:28
3

It is being displayed with the center (i.e. mean) at coefficient index zero. That is why it appears that the right half is on the left, and vice versa.

EDIT: Explore the following code:

import scipy
import scipy.signal as sig
import pylab
x = sig.gaussian(2048, 10)
X = scipy.absolute(scipy.fft(x))
pylab.plot(x)
pylab.plot(X)
pylab.plot(X[range(1024, 2048)+range(0, 1024)])

The last line will plot X starting from the center of the vector, then wrap around to the beginning.

Steve Tjoa
  • 59,122
  • 18
  • 90
  • 101
  • so how would I change the above to correct this problem? does this only affect Gausian functions? What about other wave/signals? Sorry if my maths is not that good... – chutsu Mar 22 '11 at 22:03
3

A fourier transform implicitly repeats indefinitely, as it is a transform of a signal that implicitly repeats indefinitely. Note that when you pass y to be transformed, the x values are not supplied, so in fact the gaussian that is transformed is one centred on the median value between 0 and 256, so 128.

Remember also that translation of f(x) is phase change of F(x).

Phil H
  • 19,928
  • 7
  • 68
  • 105