I've been fighting with a particular problem for a while now, and none of the existing (very similar) answers on Stackoverflow get me where I need to be.
I simply want to add a string variable as additional data to a tooltip in a highcharts scatter plot. What I want is similar to this question: Additional data to highcharter tooltip
I have modified the code from that question a bit to create a worked example. The problem is I cannot seem to get string variables (which are parsed as numbers if they are factors) to show up in the tooltip.
library("dplyr")
library("highcharter")

data<- data.frame(Company = c("A", "A", "A", "B", "B", "B"),
              Country = as.vector(c("A", "D", "F", "B", "B", "B")),
              Year = c(1,2,3,1,2,3),
              Value1 = c(100, 150, 170, 160, 150, 180),
              Value2 = c("hi", 1, 7, 6, 5, 4), stringsAsFactors = FALSE)


data<- data %>%
 group_by(name = Company) %>%
 do(data = .$Value1, Value2 = .$Value2, Country = .$Country)

series<- list_parse(data)


highchart()%>%
  hc_chart(type="scatter")%>%
  hc_add_series_list(series)%>%
  hc_tooltip(formatter= JS("function () { return 'Company: ' +
  this.series.name  + ' <br /> Value1: ' + this.point.y +
                   '<br /> Country: ' + this.point.Country ;}"))
This just produces undefined as the tooltip when I try to add in 'this.point.Country'.
I have also found this: R Highcharter: tooltip customization
Which recommends to do the tooltip customization as part of the series. However, when I do this, the plot seems to fail entirely when I pass a string variable into the series. For example, this works and also allows me to pass the z variable into the tooltip:
Errors <- data.frame(Average_R = c(90,100,110,131),
                 Minimum_R = c(50, 30, 45, 65),
                 Plant_name = c("Place","holder","name","here"),
          stringsAsFactors = F)

highchart() %>%
  hc_plotOptions(scatter = list(
  dataLabels = list(enabled = F),
  enableMouseTracking = TRUE
       )
    ) %>%
hc_series(
     list(type = "scatter",
          name = pollutant,
          data = Map(c,y = round(Errors$Average_R,2), z = Errors$Minimum_R))
     ) %>%
hc_tooltip(formatter = JS(paste0('function() {
                               return "<span style=\'color:" + this.point.color + "\'>\u25CF</span> " + this.series.name + " : <b>" + this.point.y + "</b> " + this.point.z + "<br/>";
    }')))
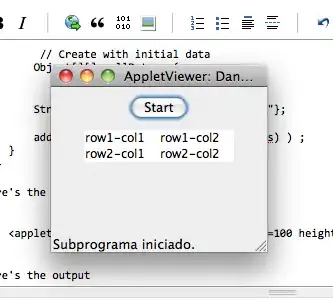
Result (dont have enough rep to post direct image)
But when I change the z variable in the data argument of hc_series to the string variable Plant_name, the entire plot fails.
Does anyone have an idea on how to fix this?


Value1: ' + this.point.y + '
Country: ' + this.point.Country ;}"` and check what its got. – muhammad umar farooq frank Jan 07 '19 at 12:18