I am comparing the performance of Eval,Query and ndarray and I need to draw a Line plot using the magic function timeit as shown below:
import pandas as pd

np.random.seed(125)
N = 100000
df = pd.DataFrame({'Arc':np.random.randint(10, size=N)})


print('===Vectorization with NumPy arrays===')
%timeit df[df.A.values > 5]

print("===Query===")
%timeit df.query('Arc > 10')


print("===Eval===")
%timeit df[df.eval('Arc > 10')]
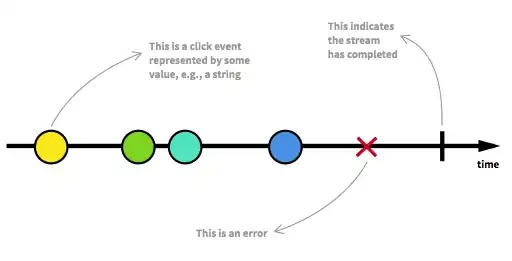
Expected Graph:
source: google
