2

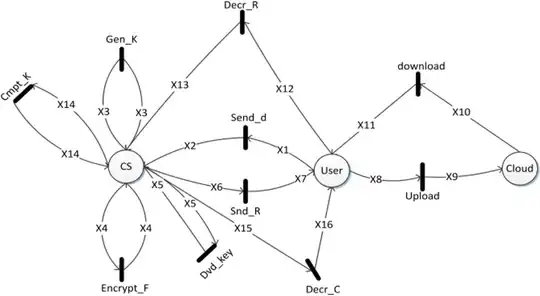
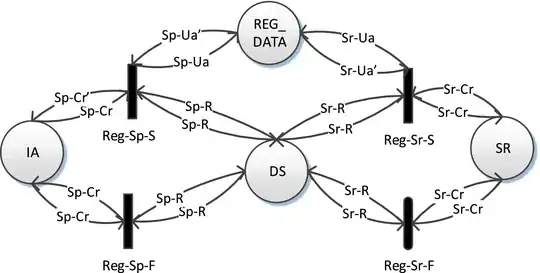
What software or tool was used to generate these high-level petri nets graph images?
I looked for many tools but could not find that one.


from https://ieeexplore.ieee.org/document/7464291


(source: springernature.com)

from https://link.springer.com/article/10.1007/s11227-013-1055-z


from https://ieeexplore.ieee.org/document/7008450

Glorfindel
  • 21,988
  • 13
  • 81
  • 109
YDKK
  • 66
  • 6
  • Hi, where do the diagrams come from? – Dima Chubarov Jan 08 '19 at 18:31
  • 1
    Hi @DmitriChubarov, I updated my question. These diagrams are come from linked papers. – YDKK Jan 09 '19 at 14:37
  • 1
    Interestingly, there are non-trivial intersections between the sets of authors of the papers. The rounded rectangles for transitions look unusual. Perhaps asking the authors of these papers would yield an answer faster than waiting for an answer here. – Dima Chubarov Jan 09 '19 at 15:08

1 Answers1

1

There is a petri net tools database at https://www.informatik.uni-hamburg.de/TGI/PetriNets/tools/db/cpnami.html although the link for the GUI Macao tool is broken.

I have used various GraphVis based tools for this in the past https://graphviz.gitlab.io/resources/ though I have not found one to date that is really simple to use.

Generally seems that the dot format is used for petri nets, this requires coding the network as a dot file in a text editor and use various tools to render it. https://en.wikipedia.org/wiki/DOT_(graph_description_language)

Hope that helps.
Jon Guiton
  • 1,360
  • 1
  • 9
  • 11