I want to try Haskell out for a small practice data analysis project.
I have a lot of data each processed and represented in Haskell Data type I named as Eap
I have a list of Eap where each Eap looks like this
Eap
  { _name = Just "someName"
    _size = Just 50.0
    _dmsTypes = Just
      ( Dms
           { _i = Just 50.0
           , _j = Just 5.0
           , _k = Just 90.0
           , _l = Nothing
           , _m = Just 100.0
           , _n = Just 10.0
           }
      )
    }
What I want to do is understand the data by plotting a 'Spider Chart' which look like this 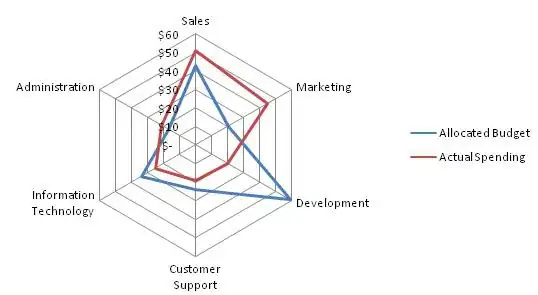
I want to plot it such that each of six vertex represents _i, _j, _k .. _n from Dms. Since there's a list of Eaps each Dms would have different colors.
Right now the best way I found is as suggested in this answer.
It involves using gnuplot. And gnuplot has wrapper as a Haskell package over at Hackage
And while it's possible to implement that in Haskell with gnuplot, the code becomes quite error prone and really unreadable. Debugging becomes a mess.
So I wanted to ask, is there a better way of plotting a 'Spider chart' of Haskell data which is relatively easy and maintainable?