I've started on my first somewhat serious programming project with PHP and am having a hard time getting good profiling information. I have used xdebug and cachegrind to profile the code, but it assumes that a function's "self" execution time is the total time the function takes to execute minus the aggregated time of any function(s) it calls.
While this is correct in essence, it does not help as much as it could when I'm trying to optimize the code. For example, I have a simple function with two if statements which returns an array with two values and it takes 26% of the total execution time according to xdebug. It uses array_key_exists, and I can see that the execution time of those function calls is around 1%. What I cannot see is how other 25% of the execution time is accounted for with the rest of the code. How long did it take for the if statements, getting the pair of values, putting those values into an array, and returning the array?
Is there some xdebug flag which I missed in the documentation? Or is there a profiling tool for PHP which will profile variable assignments, operators, the construction of the basic data types, and other non-functional calls? Preferably, something that does not assume that the script is available via a web server.
An example of something along the lines of what I'm looking for is nytprof for perl. Note that it profiles every single line of code within the function (besides the last push, which never gets executed).
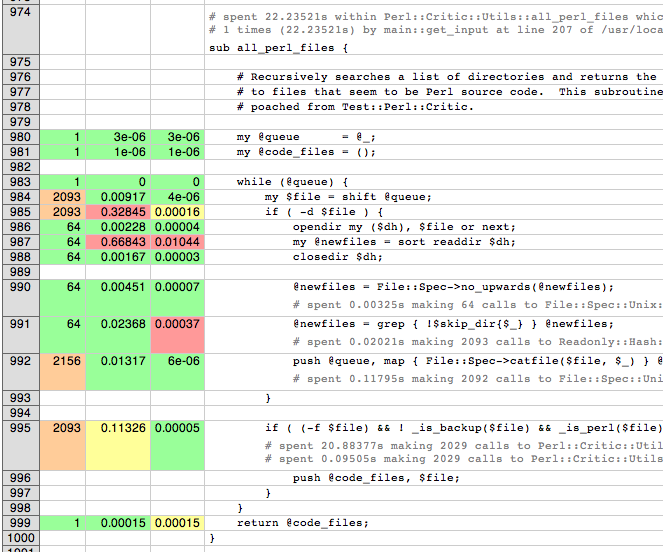