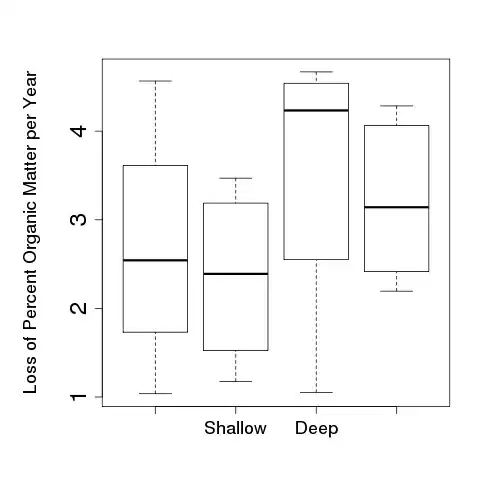
I am trying to recreate a figure similar to the attached plot (similar to the target plot).

I have found certain topics that are similar (e.g. one 3D plot comprising stacked 2D plots (How can I make 3d plot with stacked 2d plot?) or plotting mean for density distributions (plot median values on top of a density distribution in ggplot2)).
But I was unable to find an example in which there is a 3D plot of stacked 2D plots and, in addition, there is a plot of showing the relationship between the mean values of the said stacked 2D plots.
Thanks