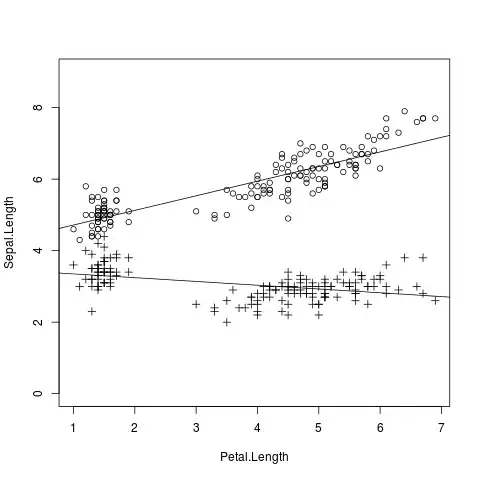
I am trying to find a way to run a regression on one independent variable with two dependent variables. I have my data organized into a data frame that is 11 observations of 3 variables, the first column containing my independent variable (V1) and the other two containing my dependent variables (V2 & V3).
I have tried the code below.
regression <- lm(binned_data$V2 + binned_data$V3 ~ binned_data$V1)
plot( binned_data$V2 + binned_dataBDI$V3 ~ binned_data$V1, pch =16, cex = 1.0, col = "black", main = "Binned Data and BDI-II Score", xlab = "BDI-II Score", ylab = "Binned Data")
abline(regression)
summary(regression)
I am looking to plot V1 on the x-axis and both dependent variables, V2 & V3, on the y-axis. I also want to include the regression line. I expect there two be 22 data points in total, as there are 11 observations for each dependent variable, but only 11 are plotted.
