3

I have created a function where the objective is to create a series of plots in a vectorzation way. The functions partially does what I want which is update update the plot based on the selected variables. However, I am not able to pass the label argument (i.e. label_x and label_y) so that the xlab and ylab are updated consistently.

library(tidyverse)
plot_scatter_with_label <- function(df,
                                    var_x,
                                    var_y,
                                    label_x,
                                    label_y,
                                    geom_smooth = FALSE,
                                    point_shape = 16,
                                    point_color = "#EB3300",
                                    point_size = 1,
                                    point_alpha = 1,
                                    smooth_method = "loess",
                                    smooth_se = FALSE,
                                    smooth_color = "navy") {
  df <- data.frame(lapply(df, function(x) as.numeric(as.character(x))))
  scatter_plot <- function(x, y) {
    p <- ggplot(df, aes_string(x = x, y = y)) + 
      geom_point(shape = point_shape, color = point_color, size = point_size, alpha = point_alpha) + 
      ylab(label_y) + xlab(label_x)
    p
  }
  map2(
    var_y, label_y,
    ~ map(var_x, scatter_plot, y = .x)
  )
}

Example

plot_scatter_with_label(
  df = mtcars,
  var_y = c("mpg", "hp"),
  label_y = c("Miles per gallon [Mpg]", "Horse power [CV]"),
  var_x = c("cyl", "gear"),
  label_x = c("Cylinders [n]", "Gear [n]")
)

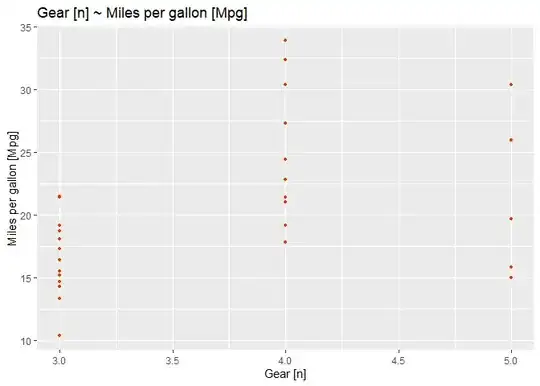
I was expecting to obtain the following plots:

1) mpg vs cyl

2) mpg vs gear

3) hp vs cyl

4) hp vs gear

It appears that I got these 4 plots but the labels are not updated as expected. It always returns the fist argument of defined in label_x and label_y.

Any help would be highly appreciated.

Best regards,

Tung
  • 26,371
  • 7
  • 91
  • 115

1 Answers1

1

We can use pmap or pwalk to pass data to plot_scatter_with_label function

library(tidyverse)

plot_scatter_with_label <- function(dat,
                                    var_x,
                                    var_y,
                                    label_x,
                                    label_y,
                                    geom_smooth = FALSE,
                                    point_shape = 16,
                                    point_color = "#EB3300",
                                    point_size = 1,
                                    point_alpha = 1,
                                    smooth_method = "loess",
                                    smooth_se = FALSE,
                                    smooth_color = "navy") {

  if (is.character(var_x)) {
    print('character column names supplied, use rlang::sym()')
    var_x <- rlang::sym(var_x)
  } else {
    print('bare column names supplied, use dplyr::enquo()')
    var_x <- enquo(var_x)
  }

  if (is.character(var_y)) {
    var_y <- rlang::sym(var_y)
  } else {
    var_y <- enquo(var_y)
  }

  p <- ggplot(dat, aes(x = !! var_x, y = !! var_y)) + 
    geom_point(shape = point_shape, color = point_color, 
               size = point_size, alpha = point_alpha) + 
    ylab(label_y) + 
    xlab(label_x) +
    ggtitle(paste0(label_x, " ~ ", label_y))
  print(p)

}

Create a data frame so that we can loop through every row and column

var_y = c("mpg", "hp")
label_y = c("Miles per gallon [Mpg]", "Horse power [CV]")
var_x = c("cyl", "gear")
label_x = c("Cylinders [n]", "Gear [n]")

var_xy <- expand.grid(var_x, var_y, stringsAsFactors = FALSE)
label_xy <- expand.grid(label_x, label_y, stringsAsFactors = FALSE)
select_dat <- data.frame(var_xy, label_xy, stringsAsFactors = FALSE)
str(select_dat)

#> 'data.frame':    4 obs. of  4 variables:
#>  $ Var1  : chr  "cyl" "gear" "cyl" "gear"
#>  $ Var2  : chr  "mpg" "mpg" "hp" "hp"
#>  $ Var1.1: chr  "Cylinders [n]" "Gear [n]" "Cylinders [n]" "Gear [n]"
#>  $ Var2.1: chr  "Miles per gallon [Mpg]" "Miles per gallon [Mpg]" "Horse power [CV]" "Horse power [CV]"

Pass each row to plot_scatter_with_label function

pwalk(select_dat, ~ plot_scatter_with_label(mtcars, ..1, ..2, ..3, ..4))

#> [1] "character column names supplied, use rlang::sym()"

#> [1] "character column names supplied, use rlang::sym()"

#> [1] "character column names supplied, use rlang::sym()"

#> [1] "character column names supplied, use rlang::sym()"

Created on 2019-02-14 by the reprex package (v0.2.1.9000)

Tung
  • 26,371
  • 7
  • 91
  • 115
  • Awesome! If this or any answer has solved your question please consider [accepting it](https://meta.stackexchange.com/q/5234/179419) by clicking the check-mark. This will help future readers who might run into the same problem. It will also give some reputation to both the answerer and yourself. There is no obligation to do this. – Tung Feb 15 '19 at 15:47
  • I love your solution and I really like this example. However, I am not sure how can these plots can be saved or stored in a list of plots so that I can select the ones I need to display. I am guessing the ploblem is the print(p) from plot_scatter_with_label() which force to print all the plots. However, if this is removed and pwalk(select_dat, ~ plot_scatter_with_label(mtcars, ..1, ..2, ..3, ..4)) is called there is no plots displayed. How can a list of plots be generated following the same methodology instead of displaying directly the plots? Thanks in advance – Juan Antonio González Sabaté Apr 02 '19 at 07:10
  • @JuanAntonioGonzálezSabaté: see this example https://stackoverflow.com/a/50930640/786542 – Tung Apr 02 '19 at 07:48