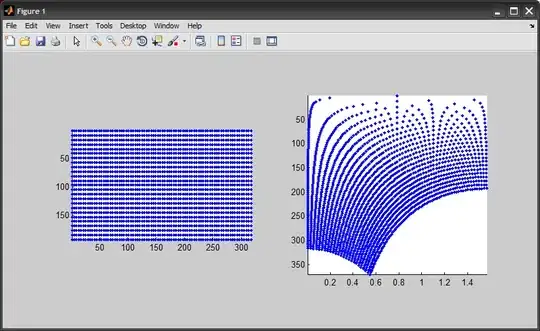
I have a honeycomb mesh sheet: that I fold to make a tube like this:

I used python with mpl_toolkits.mplot3d to generate the tube.
I've got two basic problems with that:
1) As it is, the wires from the front and back overlap rendering the structure of the tube confusing. I'd like to set some degree of opacity so that I can see better the frontal hexagonal mesh without the clutter of the back mesh. 2) In the flat sheet, I set the aspect ratio to equal, but in the 3d plot it seems distorted. It might be due to the viewpoint, but I moved it around the hexagons seem too distorted, as compared with the flat version. They seem flattened along the axis of the tube, a direction with no curvature. I tried to set the 3d aspect ratio with:
fig = plt.figure(figsize=plt.figaspect(1.0)*1.5)
ax = fig.gca(projection='3d')
but it doesn't seem to work properly. The whole code is below:
import numpy as np
from mpl_toolkits.mplot3d import Axes3D
import matplotlib.pyplot as plt
from scipy.spatial import Delaunay
Nx = 20
Ny = 20
dx = 1.0
dy =  dx*np.sqrt(3.0)/2
# number of points
Npts = Nx*Ny
points = np.zeros((Npts, 2))
# Initial positions
for j in range(Ny):
    x = 0
    for i in range(Nx):
        if j%2 ==0:
            points[j*Nx+i, 0] = x
            points[j*Nx+i, 1] = j*dy
            if i%2 == 1:
                x += 2*dx
            else:
                x += dx
        elif j%2 ==1:
            points[j*Nx+i, 0] = x-0.5*dx
            points[j*Nx+i, 1] = j*dy
            if i%2 == 1:
                x += dx
            else:
                x += 2*dx
# print points
# compute Delaunay tesselation
tri = Delaunay(points)


# obtain list of nearest neighbors
indices, indptr = tri.vertex_neighbor_vertices
plt.figure()
# Determine equal aspect ratio
plt.axes().set_aspect ('equal')
plt.plot (points[:, 0], points[:, 1], 'ro')
plt.xlabel("$x$", fontsize=18)
plt.ylabel("$y$", fontsize=18)
plt.title("Hexagonal mesh sheet")
nnIndPtr = np.array([], dtype = int)
nnIndices = np.zeros(Npts+1, dtype = int)
for k in range(Npts):
    count = 0
    for i in indptr[indices[k]:indices[k+1]]:
        # distance
        dist = np.linalg.norm(points[k]-points[i])
        # print k, i, dist
        # Build nearest neighbor list pointer from Delaunay triangulation
        if dist < 1.1:
            nnIndPtr= np.append(nnIndPtr, i)
            count += 1
    nnIndices[k+1]=nnIndices[k]+count
for k in range(Npts):
    for i in nnIndPtr[nnIndices[k]:nnIndices[k+1]]:
        plt.plot([points[i, 0], points[k, 0]],[points[i, 1], points[k, 1]], "b-")
plt.savefig('sheet.png')


#Adjusts the aspect ratio and enlarges the figure (text does not enlarge)
fig = plt.figure(figsize=plt.figaspect(1.0)*1.5)
ax = fig.gca(projection='3d')
ax.set_axis_off()
# Fold the sheet into a tube without stretching it
s = points[:, 0]
Lx = Nx*dx
x = Lx *np.cos(2*np.pi*s/Lx)
y = Lx *np.sin(2*np.pi*s/Lx)
z = points[:, 1]
ax.scatter(x, y, z, color='r')
for k in range(Npts):
    for i in nnIndPtr[nnIndices[k]:nnIndices[k+1]]:
        ax.plot([x[i], x[k]],[y[i], y[k]], [z[i], z[k]], color='b')

ax.set_xlabel('X Label')
ax.set_ylabel('Y Label')
ax.set_zlabel('Z Label')
ax.set_title("Hexagonal mesh tube")
plt.savefig('tube.png')

plt.show()