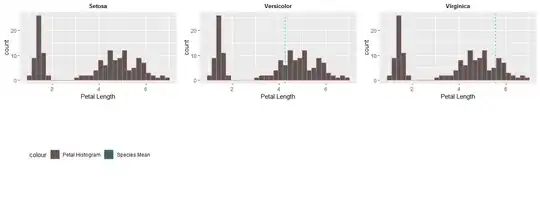
I have an issue with creating a legend for a histogram. I want to make a grid of histograms with a common legend. I have two issues.
Each histogram has a geom-vline showing a mean while the histogram shows all values. I want to make a legend which shows the colour of the geom_vline and the default grey fill of the histogram. I do not seem to be able to do this as to make a legend for fill you seem to need to have histograms split by a factor. Nor can I make a legend for the histogram using scale_colour_manual(). Similarly, I can't make a legend for the vline using scale_fill_manual()
I want to be able to centre the legend under the arranged histograms.
below is the code and the output showing my histograms adapted for the iris dataset
library(ggplot2)
library(mosaic)
library(grid)
library(gridExtra)
data("iris")

    setosaHistogram <-ggplot(data=iris)+geom_histogram(mapping=aes(x=Petal.Length,color='Petal Histogram'))+xlab('Petal Length') +
      theme(plot.title = element_text(size = 10, face = "bold",hjust = 0.5),legend.position="none") +
      ggtitle(paste("Setosa"))+
      geom_vline(aes(xintercept = mean(iris[iris$Species=='setosa','Petal.Length']), color = "Species Mean"),linetype=2)+
      scale_fill_manual(name = 'Legend',values=C("Petal Histogram"='grey','Species Mean' ="red"))

    versicolorHistogram <-ggplot(data=iris)+geom_histogram(mapping=aes(x=Petal.Length,color='Petal Histogram'))+xlab('Petal Length') +
      theme(plot.title = element_text(size = 10, face = "bold",hjust = 0.5),legend.position="none") +
      ggtitle(paste("Versicolor"))+
      geom_vline(aes(xintercept = mean(iris[iris$Species=='versicolor','Petal.Length']), color = "Species Mean"),linetype=2)+
      scale_fill_manual(name = 'Legend',values=C("Petal Histogram"='grey','Species Mean' ="red"))

    virginicaHistogram <-ggplot(data=iris)+geom_histogram(mapping=aes(x=Petal.Length,color='Petal Histogram'))+xlab('Petal Length') +
      theme(plot.title = element_text(size = 10, face = "bold",hjust = 0.5),legend.position="none") +
      ggtitle(paste("Virginica"))+
      geom_vline(aes(xintercept = mean(iris[iris$Species=='virginica','Petal.Length']), color = "Species Mean"),linetype=2)+
      scale_fill_manual(name = 'Legend',values=C("Petal Histogram"='grey','Species Mean' ="red"))

    g <- ggplotGrob(setosaHistogram +
                      theme(legend.position = 'bottom'))$grobs
    #> `stat_bin()` using `bins = 30`. Pick better value with `binwidth`.
    legend <- g[[which(sapply(g, function(x) x$name) == "guide-box")]]

    arrangedPlots<-grid.arrange(setosaHistogram,versicolorHistogram,virginicaHistogram,legend,ncol=3, nrow=2)
